
Figure 6.
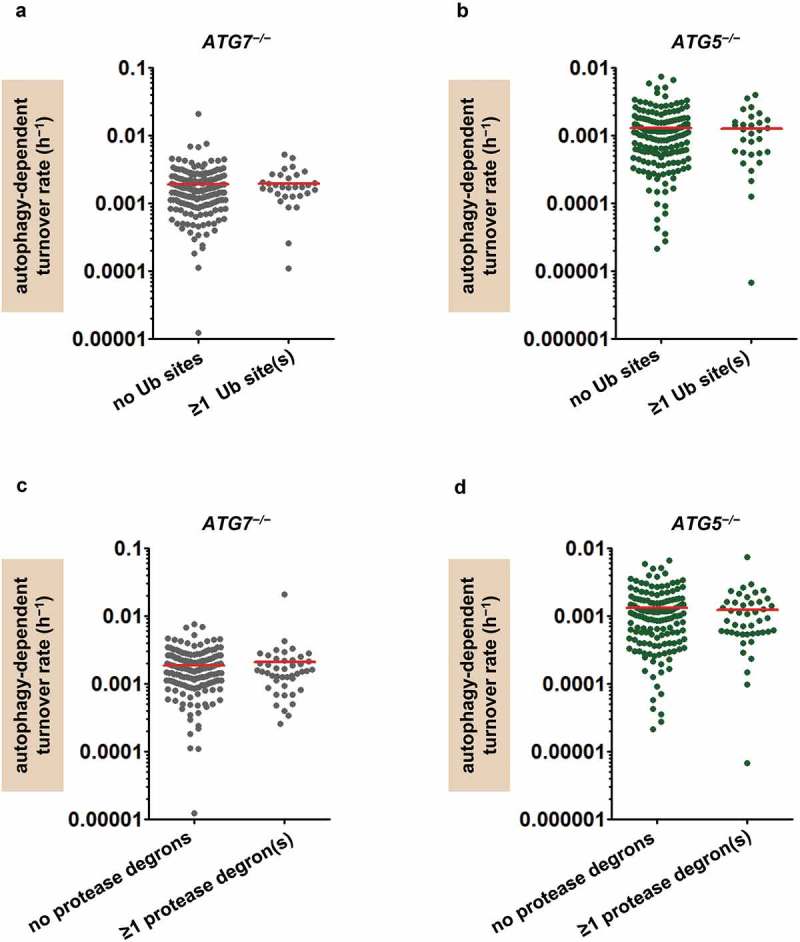
The protein-selective effects of autophagy in ATG7−/− and ATG5−/− cells are not explained by genetic compensation. (a) Autophagy-dependent turnover rates (h−1) of mitochondrial proteins from ATG7−/− fibroblasts with and without evidence of proteasomal turnover (ubiquitinated [Ub] sites) [48]. Red lines indicate means; n = 44 proteins with ubiquitinated sites, 167 without. (b) Autophagy-dependent turnover rates (h−1) of mitochondrial proteins from ATG5−/− fibroblasts with (n = 45) and without (n = 151) ubiquitinated sites, as in panel A. (c) Autophagy-dependent turnover rates (h−1) of individual mitochondrial proteins from ATG7−/− fibroblasts with (n = 31) and without (n = 180) degrons for mitochondrial proteases Lon and YME1L1. (d) Autophagy-dependent turnover rates (h−1) of individual mitochondrial proteins from ATG5−/− fibroblasts with and without protease degrons (n = 30 proteins with degrons, 166 without). All comparisons of means in panels A through D are nonsignificant by Student t test.