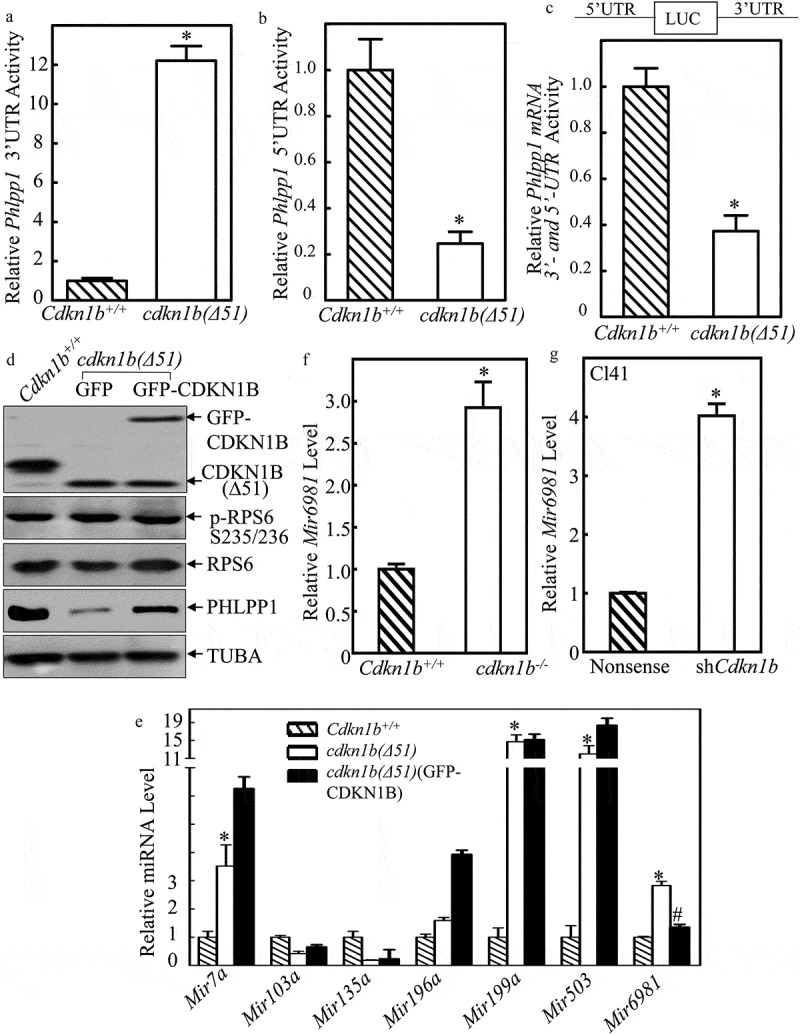
Figure 2.

CDKN1B promoted Phlpp1 mRNA 5ʹ-UTR activity accompanied with inhibition of Mir6981 expression. (a–c) Wild-type Phlpp1 mRNA 3ʹ-UTR-driven luciferase reporters(a), 5ʹ-UTR-driven luciferase reporters (b), The luciferase reporter containing both the 5ʹ-UTR and 3ʹ-UTR regulatory regions (c), were cotransfected with pRL-TK into Cdkn1b+/+ and cdkn1b(Δ51) cells, respectively. Twenty-four h post transfection, the transfectants were extracted for evaluation of the luciferase activity. TK was used as an internal control. The results were presented as Phlpp1 3ʹ-UTR activity (a), 5ʹ-UTR activity (b), or Phlpp1 mRNA 3ʹ and 5ʹ-UTR activity (c) relative to Cdkn1b+/+ cells. Each bar indicates a mean±SD of triplicates. The symbol (*) indicates a significant difference in comparison to Cdkn1b+/+ cells (P < 0.05). (d) Cell extracts from Cdkn1b+/+, cdkn1b(Δ51)(GFP), and cdkn1b(Δ51)(GFP-CDKN1B) cells were subjected to western blot analysis for protein expression of CDKN1B, P-RPS6, RPS6, and PHLPP1. TUBA was used as a protein loading control. (e) For the cells indicated, the expression levels of Mir7a, Mir103a, Mir135a, Mir196a, Mir199a, Mir503, and Mir6981 were evaluated by real-time PCR. The results were normalized to Rnu6. The symbol (*) indicates a significant increase in comparison to Cdkn1b+/+ cells, while the symbol ‘#’ indicates significant inhibition in comparison to cdkn1b(Δ51) cells (P < 0.05). (f,g) The expression levels of Mir6981 were evaluated by real-time PCR in Cdkn1b+/+ vs. cdkn1b−/- cells (f), and Cl41(Nonsense) vs. Cl41(shCdkn1b) cells (g). The results were normalized to Rnu6. Each bar indicates a mean±SD of triplicates. The symbol (*) indicates a significant difference in comparison to Cdkn1b+/+ cells or Cl41(Nonsense) cells (P < 0.05).
