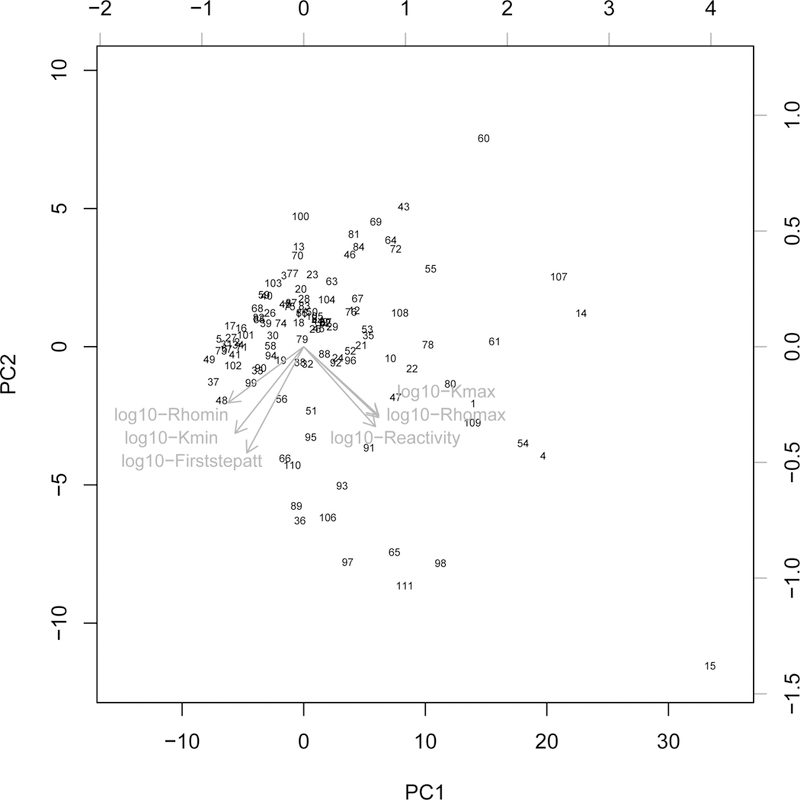
Figure 1:

First factorial plan of the phylogenetic principal component analysis performed on 6 log-10 transformed transient metrics measured in 111 mammalian species (numbered from 1 to 111). The correspondence between number and species name is given in Table A1. The six log10-transformed transient metrics are displayed in red and their meanings are presented in Table 1.
