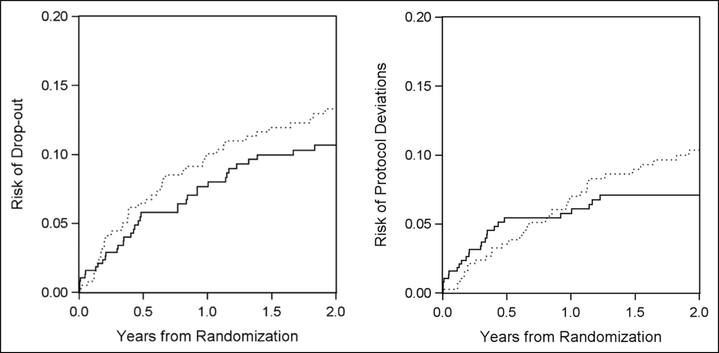
Figure 1.
Risks of dropout and protocol deviations over 2 years by arm in the trial, respectively.
Solid line represents the three-drug arm, and dotted line represents the four-drug arm. The upper panel represents risks of dropout (hazard ratio = 1.27, 95% CI: 0.82, 1.96 (comparing four-drug arm to three-drug arm)). The lower panel represents risks of protocol deviations (hazard ratio = 1.35, 95% CI: 0.80, 2.26 (comparing four-drug arm to three-drug arm)).

