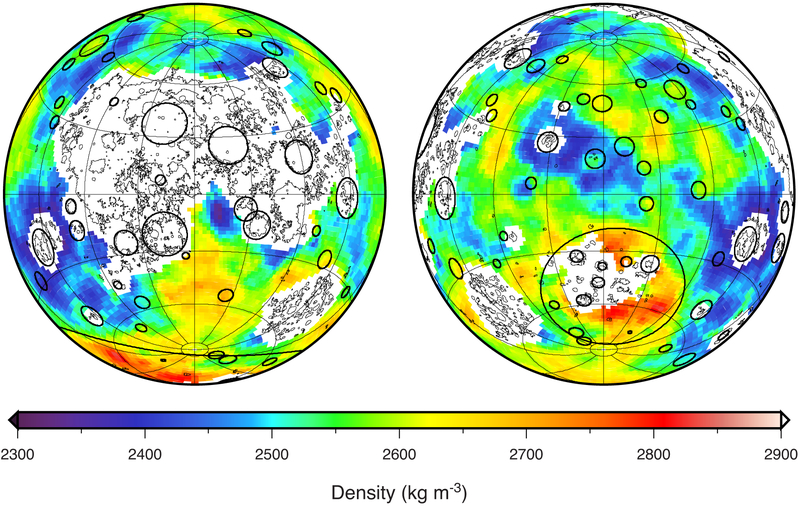
Fig. 1.
Bulk density of the lunar crust from gravity and topography data. At each point on a 60-km equally spaced grid, the bulk density was calculated within 360 km diameter circles (spanning 12° of latitude). Thin lines outline the mare basalts, and solid circles correspond to prominent impact basins, whose diameters are taken as the region of crustal thinning in Fig. 3. The largest farside basin is the South Pole-Aitken basin. Data are presented in two Lambert azimuthal equal-area projections centered over the near (left) and far (right) side hemispheres, with each image covering 75% of the lunar surface, and with gridlines being spaced every 30°. Names of prominent impact basins are annotated in Fig. 3.

