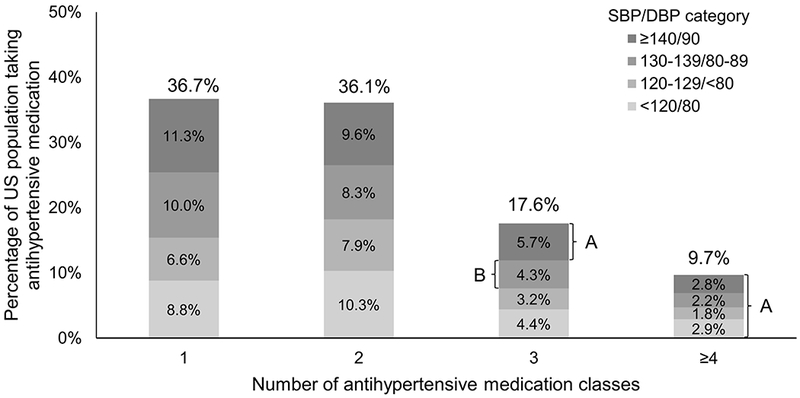
Figure 1.

Distribution of US adults taking antihypertensive medication by number of antihypertensive drug classes they were taking and blood pressure levels.
SBP: Systolic blood pressure, DBP: Diastolic blood pressure.
Due to rounding, the numbers in the figure sum to 100.1% instead of 100%.
A: These individuals have apparent treatment resistant hypertension according to the 2008 and 2018 American Heart Association Scientific Statement definitions.
B: All of these individuals have apparent treatment resistant hypertension according to the 2018 American Heart Association’s Scientific Statement definition. Also, 2.3% of these individuals (i.e., those in this group with diabetes or chronic kidney disease) have apparent treatment resistant hypertension according to the 2008 American Heart Association’s Scientific Statement definition.
