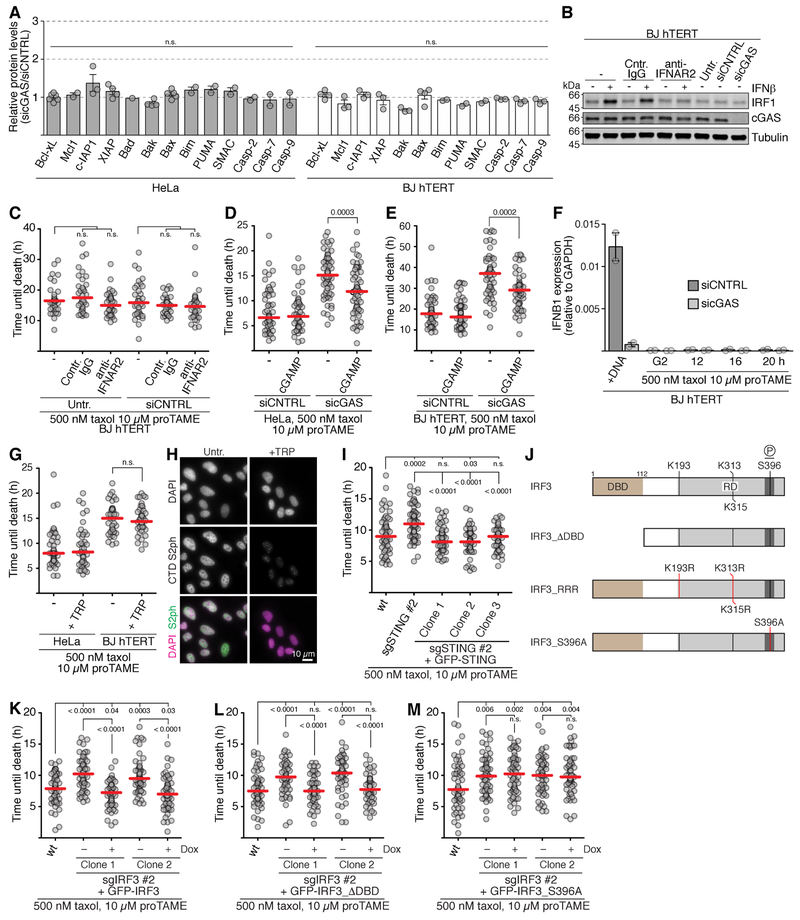
Figure 6. The cGAS-cGAMP-STING-IRF3 axis promotes mitotic cell death independently of transcriptional induction.
(A) Western blot analysis (means and SEM) of the indicated proteins in the indicated cell lines arrested in G2.
(B and C) Treatment of cells with neutralizing anti-IFNAR 2 antibodies. (B) Western blot analysis of BJ hTERT cells following IFNβ addition with and without anti-IFNAR2 antibodies.
(C) Mitotic lifespan of the indicated BJ hTERT cells (n=34-40 each) grown in the presence of the indicated antibodies and released from G2 arrest into 500 nM taxol 10 μM proTAME.
(D and E) Mitotic lifespan of cells (n=50 each) arrested in G2 and released into 500 nM taxol 10 μM proTAME. After 1.5 h (HeLa Cells, D) or 4 h (BJ hTERT cells, E), cGAMP was added to 33 μM for the indicated cells. Only cells that had already entered mitosis were analyzed.
(F) IFNB1 expression by quantitative PCR in the indicated cells. +DNA, asynchronous cells transfected with naked DNA. Cells were released from G2 arrest into media containing the indicated drugs. Mean and range from two experiments.
(G and H) Analysis of transcription inhibition. (G) Mitotic lifespan of cells (n=60 each) arrested in G2 and released into 500 nM taxol 10 μM proTAME. After 1.5 h (HeLa) or 4 h (BJ hTERT), triptolide (TRP) was added to 10 μM for the indicated cells. Only cells that had already entered mitosis were included in the analyzed. (H) Verification of transcription inhibition by TRP. Asynchronous HeLa cells treated with 10 μM TRP were stained with antibodies against serine 2 phosphorylation of the C-terminal tail of RNA polymerase II (CTD S2ph).
(I) Mitotic lifespan of the indicated cells (n=60 each) arrested in G2 and released into 500 nM taxol 10 μM proTAME. See Figure S6G for Western blot analysis.
(J) IRF3 rescue constructs. DBD, DNA-binding domain (gold). RD, regulatory domain (light gray). Region around S396 (dark gray).
(K–M) Mitotic lifespan of an IRF3 disruption cell line containing rescue constructs expressing doxycycline-inducible wild type GFP-IRF3 (K), a mutant lacking the DNA binding domain (L) or a mutant expressing GFP-IRF3 carrying the S396A mutation (M). See Figures S6H-S6J for Western blot. Cells were arrested in G2 and released into 500 nM taxol 10 μM proTAME (n=60 each).
Red lines, median. siCNTRL, non-targeting control siRNA; sicGAS, siRNA targeting cGAS; Untr., no siRNA treatment.
See also Figure S6.

