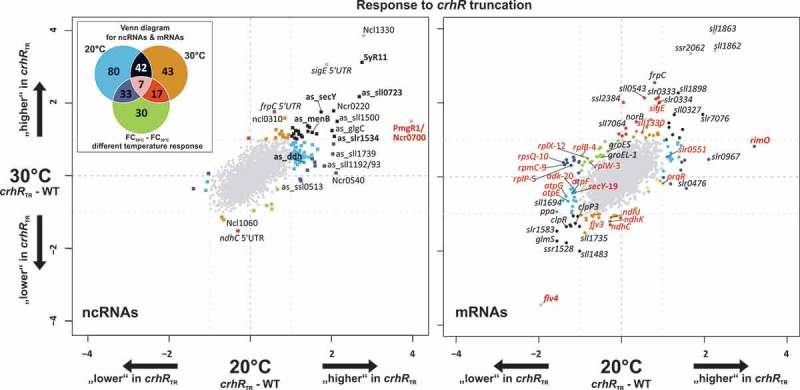
Figure 1.

Microarray results showing the transcriptome response to crhR inactivation. The left scatter plot displays the log2 fold changes of the comparison crhRTR versus wild type (WT) at 20°C (x-axis) and 30°C (y-axis) for sRNAs and asRNAs, while the right plot shows the FCs for mRNAs. Significantly differentially expressed genes (absolute log2 FC ≥ 1, adjusted p-value ≤ 0.05) are color-coded, matching the colors in the Venn diagram in the upper left corner. RNAs that are only differentially expressed at 20°C, 30°C or in the comparison of the temperature responses (FC20°C – FC30°C) are colored blue, orange or green, respectively. The colors of RNAs that are significantly and differentially expressed at more than one condition can be taken from the overlapping areas in the Venn diagram. The numbers in the fields of the Venn diagram are the total numbers of differential expressed genes at the specific comparison including sRNAs, asRNAs and mRNAs. Selected members of the ribosomal operon sll1799-ssl3441 have red labels, with a number following the gene name to indicate the position in the operon. Transcripts specifically mentioned in the discussion are also labeled in red. The expression profiles of RNAs shown in bold face were verified by northern blot.
