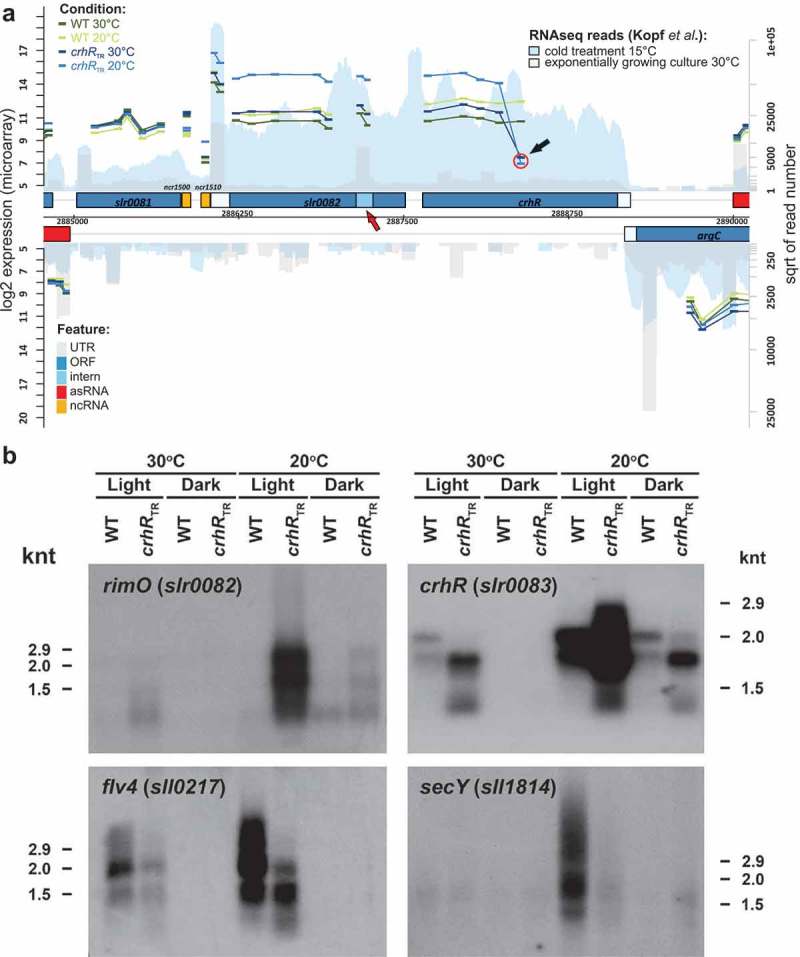
Figure 2.

Verification of mRNA abundance changes. (A) Transcript accumulation in the genomic region containing the rimO(miaB)-crhR operon. The results of this study (microarray experiments) are combined with the coverage from a previous RNAseq analysis [34]. Both DNA strands are shown. Genes are drawn as blue boxes, UTRs as white-blue boxes, internal RNAs as light blue boxes, asRNAs as red boxes and intergenic sRNAs as yellow boxes. The numbers of RNAseq reads from an exponentially growing culture at 30°C are plotted in light grey and after transfer to 15°C for 30 min in blue. See also the legend given in the upper right corner. The read numbers are given in a log2 scale represented by the right y-axis. The normalized log2 expression values of the microarray experiments are plotted for each probe as short vertical tabs, which span the corresponding hybridization region. The scale for the microarray data is given at the left y-axis (normalized fluorescence values). The values for the wild type (WT) at 30°C and at 20°C are pictured in dark and light green, for crhRTR at 30°C and at 20°C in dark and light blue. All probes (thicker bars) corresponding to a single RNA feature are connected by lines. The red circle and the black arrow indicate the position of the first probe following the antibiotic cassette insertion used to generate the truncation. The red arrow points to a potential transcription start site within the rimO(miaB) slr0082 gene. (B) Northern analysis of microarray-predicted mRNA abundance changes in response to crhR mutation. Gene-specific probing was performed on total RNA (5 µg) isolated from wild type or crhRTR cells grown at 30°C, cold stressed at 20°C or incubated in the dark for three h, as indicated.
