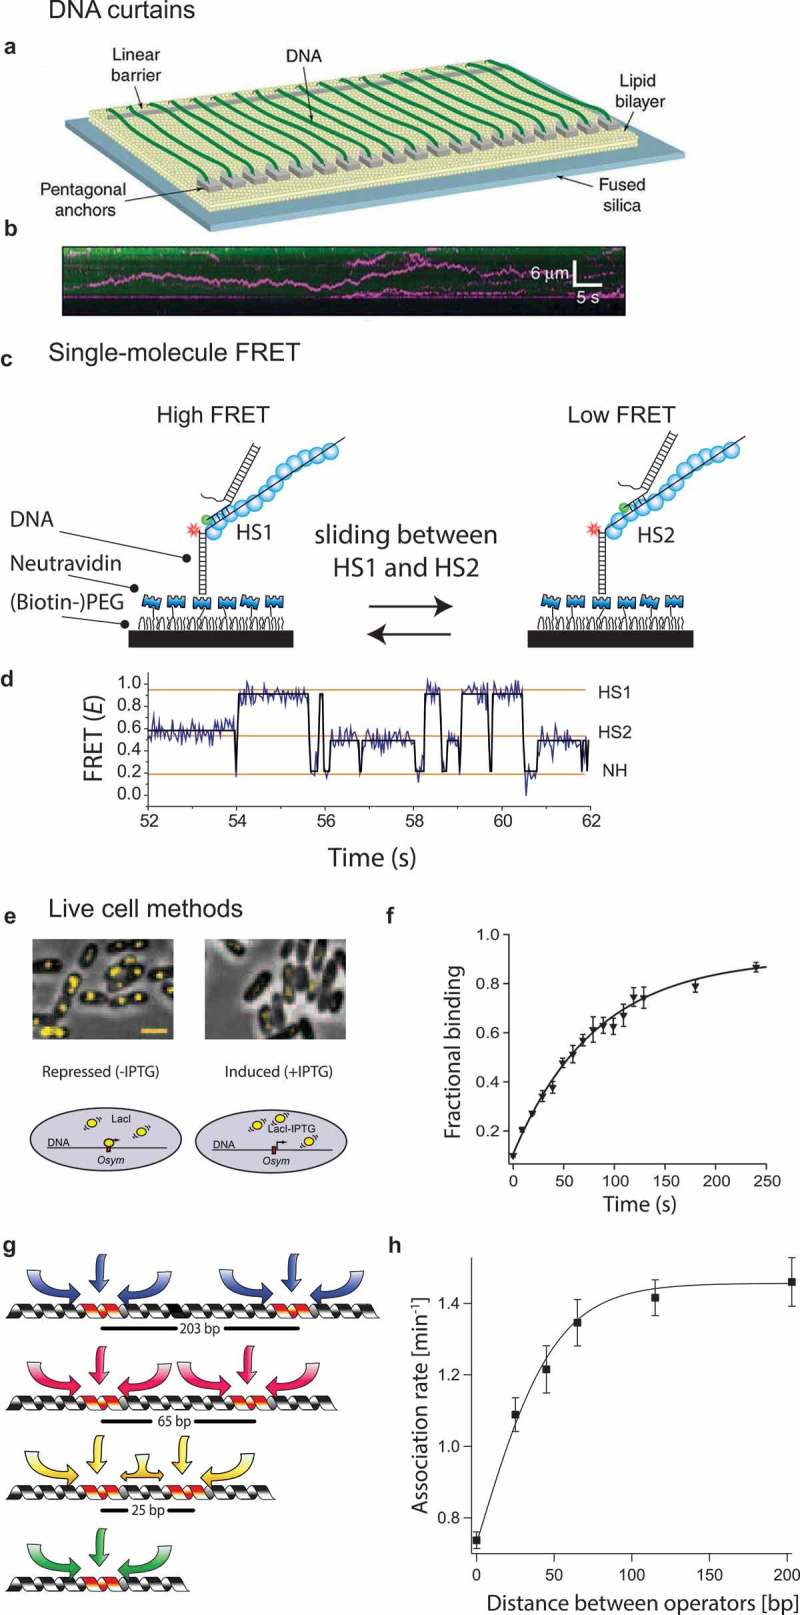
Figure 2.

Fluorescence-based single-molecule techniques for studying target search.
(a) Diagram of the nanofabricated DNA curtain device that contains a barrier against lipid diffusion for stretching the DNA. Here, flow is used to stretch the DNA strand. On the other side, a pentagonal structure is used to anchor the other end of the strand [10]. As a result of this, hundreds of DNA strands are aligned in parallel and can be imaged simultaneously. (b) The DNA curtains are visualized through YOYO-1 dye staining. A fluorescent probe (pink) is attached to the protein of interest, and the position (vertical axis) of said protein is tracked in time (horizontal axis). By imaging both the DNA strand and the fluorescent probe, one can visualize how it travels along the DNA strand [10]. (c) Single-molecule FRET assay showing a RecA filament (blue) containing two homology sites. Recognition of homology site 1 (HS1) or homology site 2 (HS2) results in the appearance of a high FRET state and an intermediate FRET state, respectively, [14]. (d) Single-molecule time trace showing FRET for an immobilized ssDNA with two identical homology sequences HS1 and HS2. Docking of double-stranded DNA at a location outside a FRET sensitive regime results in a low FRET (NH) state [14]. (e) Single operator binding assay used by the Elf lab [9]. (Top) Overlays of E. coli cells in phase contrast and with fluorescently labelled LacI (yellow). In absence of IPTG (left), LacI is able to bind to the single operator site LacOsym, resulting in a diffraction-limited spot. In the presence of IPTG (300 μM) (right), LacI is unable to bind due to the competition with IPTG and diffuses too rapidly resulting in diffusional smears [9]. (f) Graph plotting the fraction of stable LacI binding vs the time after removal of the IPTG [9]. (g) The mean sliding length is determined by placing two identical targets in varying distances. If the mean sliding length of said targets overlaps, the LacI protein will effectively only sense one target, resulting in a decreased association rate [9]. (h) Rate of binding plotted against the inter-target distance [9]. Permission has been obtained for the above figures. Copyright 2010 Nature.
