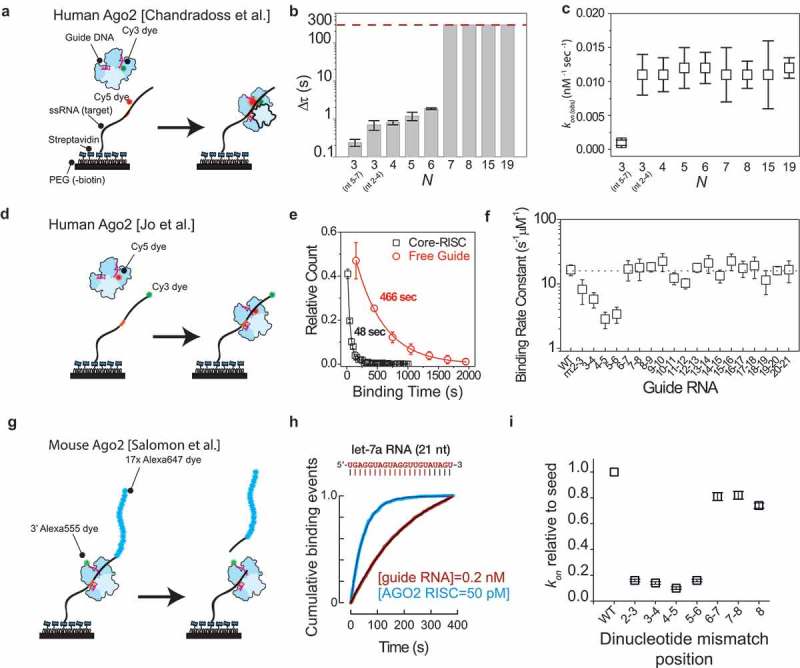
Figure 5.

Studies of the initial search and recognition of AGO2 through single-molecule fluorescence techniques.
(a) Schematic drawing of the experimental assay used by Chandradoss et al. [67]. Target RNA is immobilized on the surface through biotin-streptavidin conjugation. The target RNA is labelled with an acceptor-dye (Cy5) while the donor dye (Cy3) is located on the miRNA guide. In absence of hAgo2-RISC binding to the strand, no signal is observed. Once it binds to the minimal target motif, the proximity of donor and acceptor induces Forster resonance energy transfer (FRET), resulting in a high acceptor signal. The duration of the high acceptor signal can be used to estimate the dwell time Δt. (b) The dwelltime Δt plotted versus the number N of seed-paired bases. The dashed line indicates the upper limit of dwell time estimation [67]. (c) The binding rate plotted for various values of N of base pairs [67]. (d) Schematic drawing of the single-molecule assay by Jo et al. where through FRET of the Cy5 and the Cy3 dye the binding can be ascertained [68]. (e) Dwell time distribution of core-RISC (black squares) and free let7 miRNA (red circles) fitted with a single-exponential decay [68]. (f) Binding rate plotted versus dinucleotide-mismatched guide RNAs [68]. (g) Schematic assay for Salomon et al. [69]. Seventeen Alexa647 dyes are attached to the 5ʹ end of the target RNA to distinguish cleavage from photobleaching. (h) Comparison of target binding rates (kon) for 21 nt sequences for let-7a RNA and miR-21 RNA. Inset shows a representative intensity trace [69]. (i) Comparison of target binding rate for let-7a sequences with complete seed-matched pairing or seed-matched pairing bearing dinucleotide mismatches [69]. Permission has been obtained for the above figures. Copyright 2015 Elsevier.
