
Figure 9.
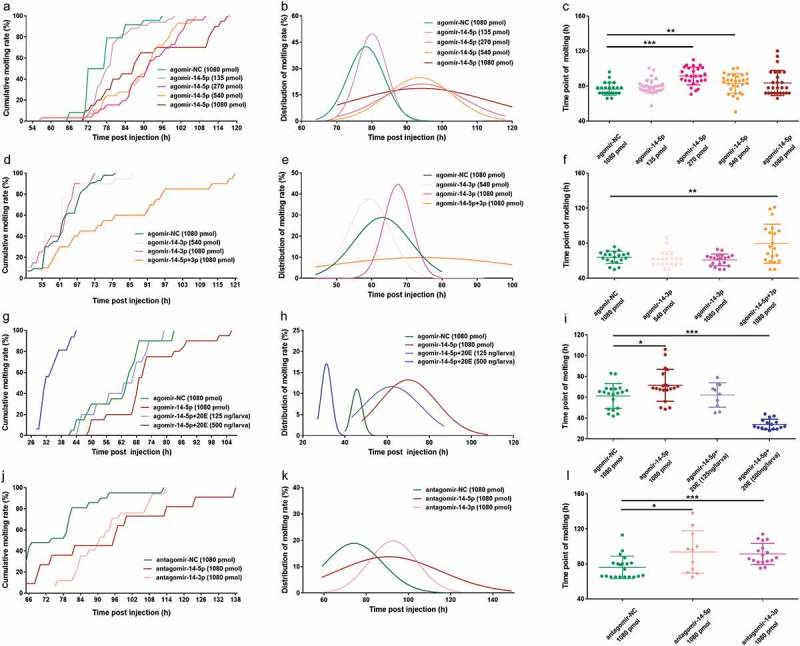
Oversupply and inhibition of Bmo-miR-14-5p delayed the moulting timing with an increased variation. (a) Cumulative molting rate of larvae injected with different amounts of agomir-14-5p. (b) Fitting curve for moulting rate distribution of larvae injected with different amounts of agomir-14-5p. (c) Moulting time point for larvae injected with different amounts of agomir-14-5p. (d) Cumulative moulting rate of larvae injected with agomir-14-3p. (e) Fitting curve for moulting rate distribution of larvae injected with agomir-14-5p. (f) Moulting time point for larvae injected with agomir-14-3p. (g) Cumulative moulting rate of larvae rescued with 20E when injected with agomir-14-5p. (h) Fitting curve for moulting rate distribution of larvae rescued with 20E when injected with agomir-14-5p. (i) Moulting time point for larvae rescued with 20E when injected with agomir-14-3p. (j) Cumulative moulting rate of larvae injected with antagomir-14-5p and antagomir-14-3p. (K) Fitting curve for moulting rate distribution of larvae injected with antagomir-14-5p and antagomir-14-3p. (l) Moulting time point for larvae injected with antagomir-14-5p and antagomir-14-3p. The least squares fit method was used for the nonlinear regression fitting with Gaussian distribution. Data represent mean ± SEM (N = 20). Variances of each group were assessed by Levene’s test and mean was assessed by Student’s t test or Mann–Whitney U test. * P < 0.05, ** P < 0.01, *** P < 0.001.