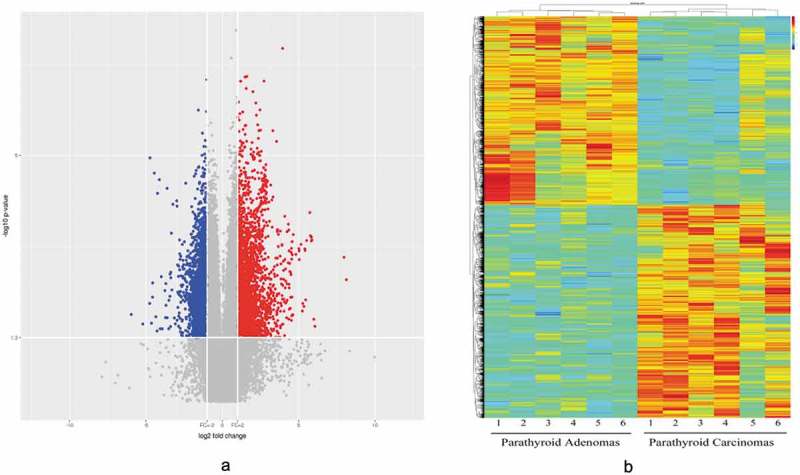
Figure 2.

A volcano plot (2A) and heat map (2B) were used to identify the difference in circRNA expression between the PC and PA samples. In the volcano plot, the log2 fold change is plotted on the x-axis, and the negative log10 p-value is plotted on the y-axis. The heat map visualizes the differential circRNA expression (p < 0.05 and fold change ≥ 2.0 or ≤ 0.5) between the PC and PA samples. Each column represents one sample, and each row indicates a circRNA transcript. The colour scale ranges from blue (low intensity) and yellow (medium intensity) to red (strong intensity). PC, parathyroid carcinoma; PA, parathyroid adenoma.
