
Figure 5.
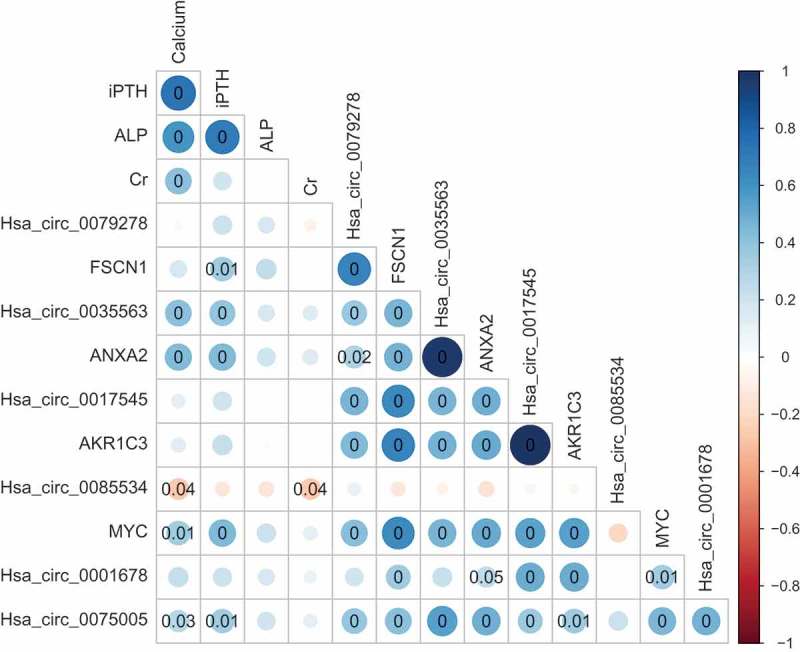
The Spearman’s correlation matrix between the clinical parameters and detected circRNAs and mRNAs. The size and colour intensity of the circle denote the correlation coefficient value. Positive correlations are visualized in blue and negative correlations in red scale. P-value is marked in the matrix if P-value is below 0.05, which represents statistical significance. iPTH, intact parathyroid hormone; ALP, alkaline phosphatase.