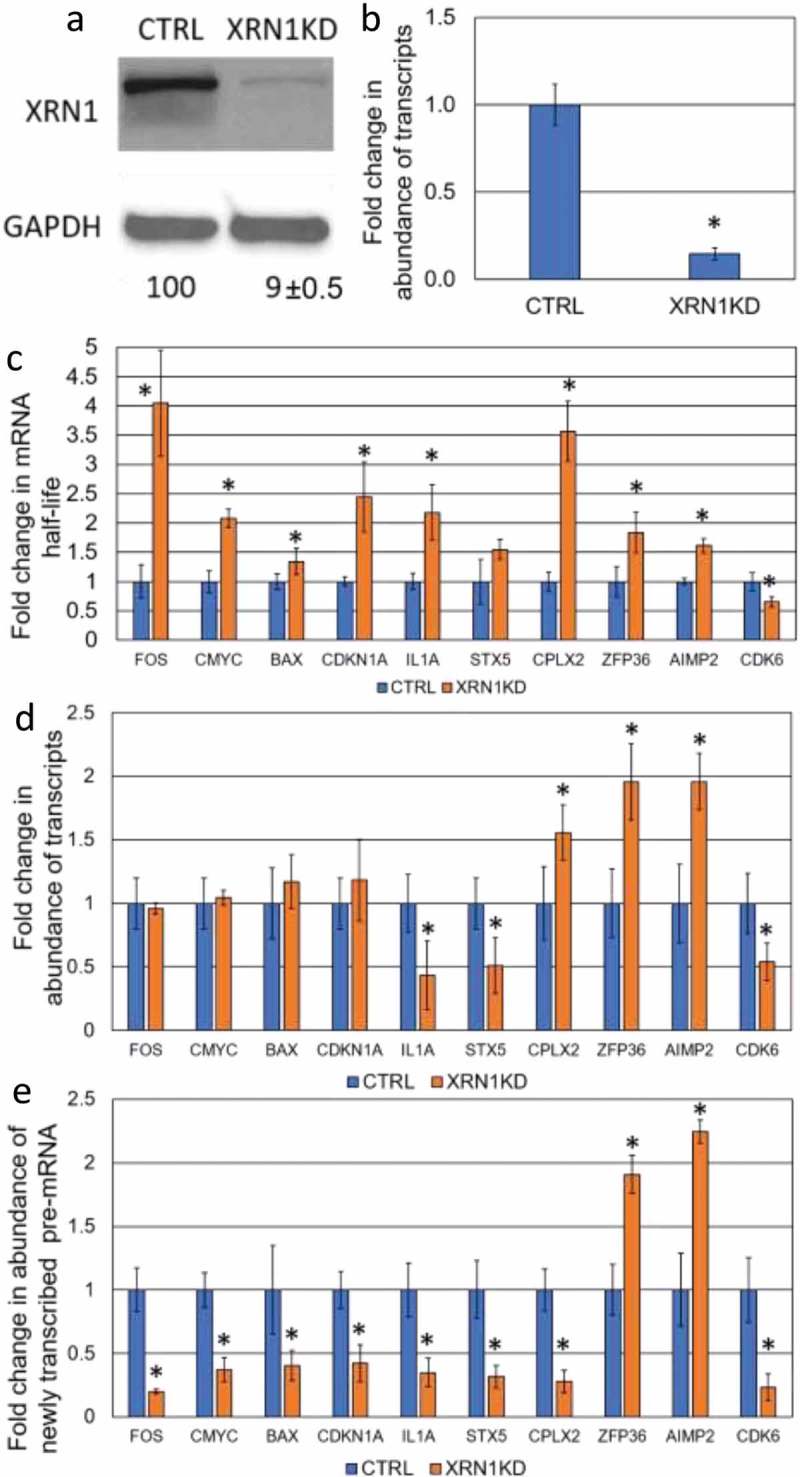
Figure 1.

Determination the effect of XRN1-KD on the steady-state level of specific transcripts. (a) The level of XRN1 protein expression upon shRNA-mediated knockdown in CTRL (control) and XRN1-KD cell lines. The protein level was determined by western blotting and normalized to that of GAPDH and the average percentage of relative expression is shown below each lane with the standard deviation derived from three independent experiments. (b) qRT-PCR showing the fold change of the Xrn1 transcript in CTRL and XRN1-KD cell lines for comparison, error bars indicate deviation from three independent experiments and asterisks indicate significant differences (p < 0.05). (c) The fold change in mRNA stability for each transcript was assessed by normalization of the half-life of mRNA in XRN1-KD to that in CTRL cell lines. The half-life of each mRNA was determined by qRT-PCR. (d) The fold change in abundance of transcripts following XRN1 depletion was measured by qRT-PCR in XRN1-KD and normalized to that in CTRL cell lines. (e) The abundance of newly transcribed pre-mRNAs was assessed by qRT-PCR and normalized to the abundance of 7SL RNA. The fold change in the pre-mRNA was measured by normalization of the abundance of each pre-mRNA in XRN1-KD to that in CTRL cell lines. The error bars in (c), (d) and (e) represent the standard error of the mean measured from three independent experiments and three technical repeats and asterisks indicate statistically significant differences (p < 0.05).
