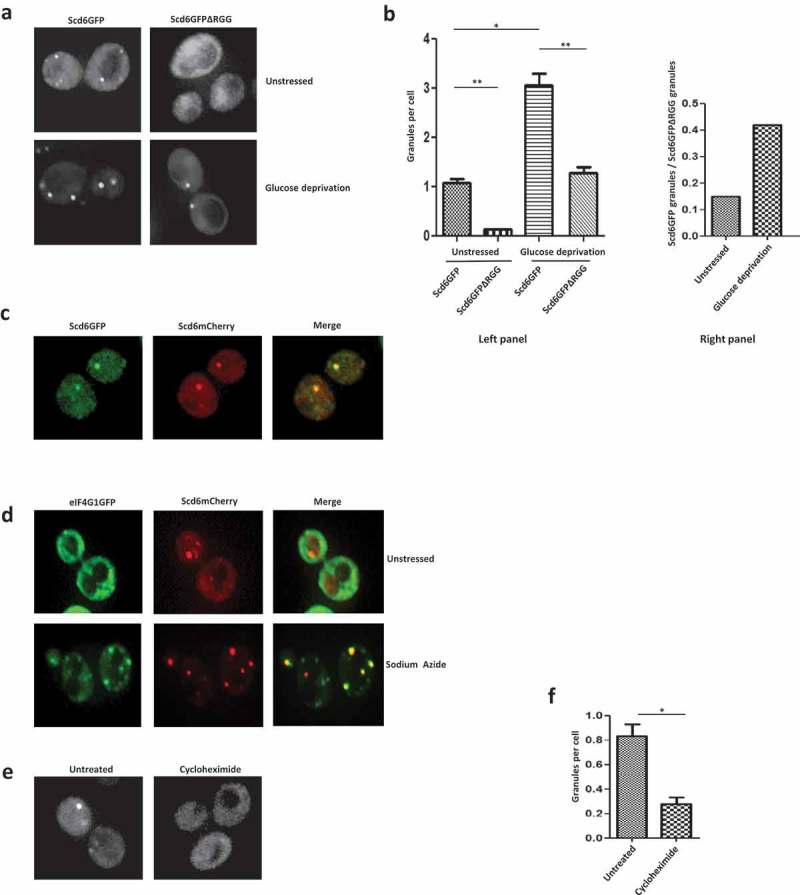
Figure 3.

Scd6 localizes to foci in the absence of stress. a) BY4741 cells expressing Scd6GFP and Scd6GFPΔRGG were grown until OD600 0.35–0.5 followed by 10 minute glucose deprivation stress. Live cell imaging was performed for stressed and unstressed cells. b) In the left panel, quantitation of three independent experiments performed as in a has been represented (Scd6GFP Unstressed-Scd6GFPΔRGG Unstressed p=0.0079, Scd6GFP Unstressed-Scd6GFP Stressed p=0.0105, Scd6GFP Stressed-Scd6GFPΔRGG Stressed p=0.0078). In the right panel, the ratio of Scd6GFP granules/cell to Scd6GFPΔRGG/cell in unstressed and glucose deprived condition has been represented. The ratio has been determined based on the quantitation presented in b. c) Scd6mCherry was expressed in SCD6GFP strain, grown until OD600 0.35–0.5 followed by live cell imaging. d) Scd6mCherry was expressed in EIF4G1GFP strain, grown until OD600 0.35–0.5 followed by treatment with 0.5% Sodium Azide for 30 minutes and live cell imaging. e) Scd6mCherry expressing cells were grown until OD600 0.35–0.5 followed by treatment with Cycloheximide(100ug/ml) for 5 minutes and live cell imaging was performed. f) Quantitation of three independent experiments performed as in e (p=0.0191).
