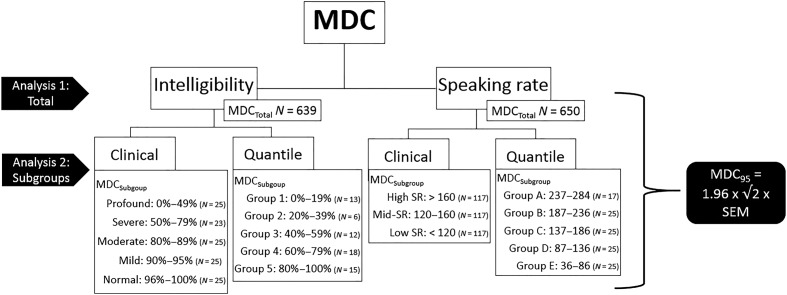
Figure 1.
Schematic of minimally detectable change analyses. N for MDCTotal reflects the total number of subjects in the sample with available data. The number of subjects in the subgroup analyses has been reduced to allow for a similar number of participants in each subgroup. MDC = minimally detectable change; SR = speaking rate; SEM = standard error of measurement.

