
Figure 4.
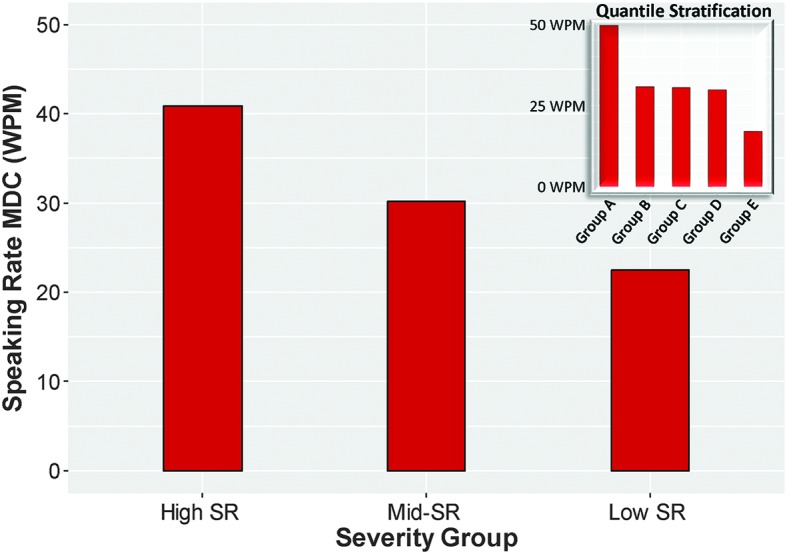
MDCs of speaking rate across severity levels based on a clinical stratification of dysarthria severity (large graph) and based on a quantile stratification of dysarthria severity (small graph). In both stratifications, the groups with the highest speaking rates have the highest MDCs for speaking rate, and groups with the slowest speaking rates have the lowest MDCs for speaking rate. Speaking rate for each group on the graph is as follows: high SR = > 160 WPM, mid-SR = 120–160 WPM, low SR = < 120 WPM, Group A = 237–284 WPM, Group B = 187–236 WPM, Group C = 137–186 WPM, Group D = 87–136 WPM, Group E = 36–86 WPM. MDC = minimally detectable change; WPM = words per minute; SR = speaking rate.