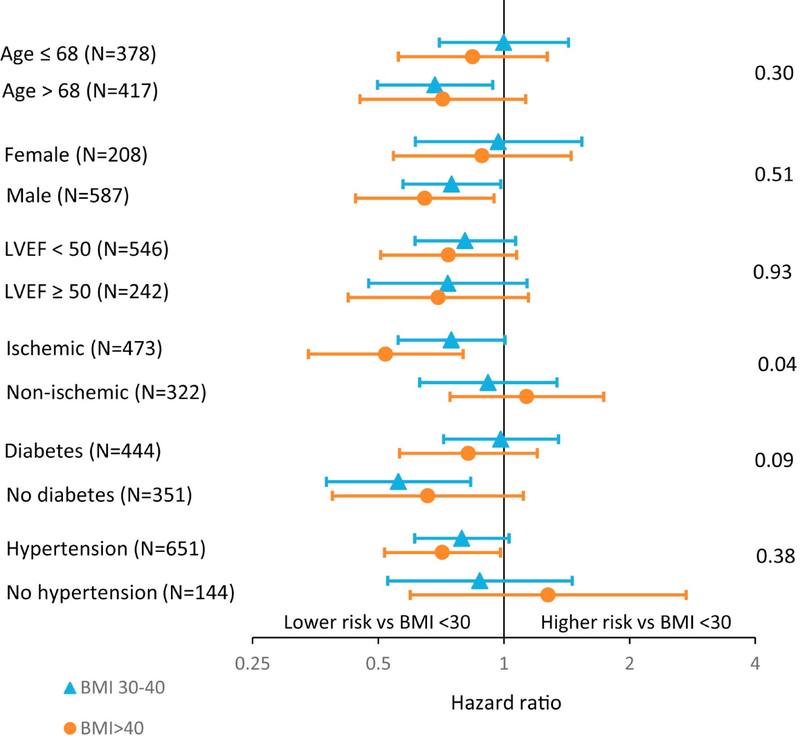
Figure 4.
Forest Plots Show Relationship Between Subgroups and Composite Endpoint According to BMI category
Forest plots show relationship between relevant subgroups (age, sex, LVEF <50% vs ≥50%, ischemia cause, presence of diabetes or hypertension) and the composite endpoint according to BMI category (<30, 30–40, >40 kg/m2), with BMI <30 kg/m2 serving as the reference group. Markers to the left of 1 indicate whether patients in that particular BMI category have a lower risk of composite endpoint than those with BMI <30 kg/m2. Interaction p values are shown. The only subgroup that showed a relationship different from that of the composite endpoint according to BMI category was ischemia versus nonischemia cause. LVEF = left ventricular ejection fraction; other abbreviation as in Figure 1.

