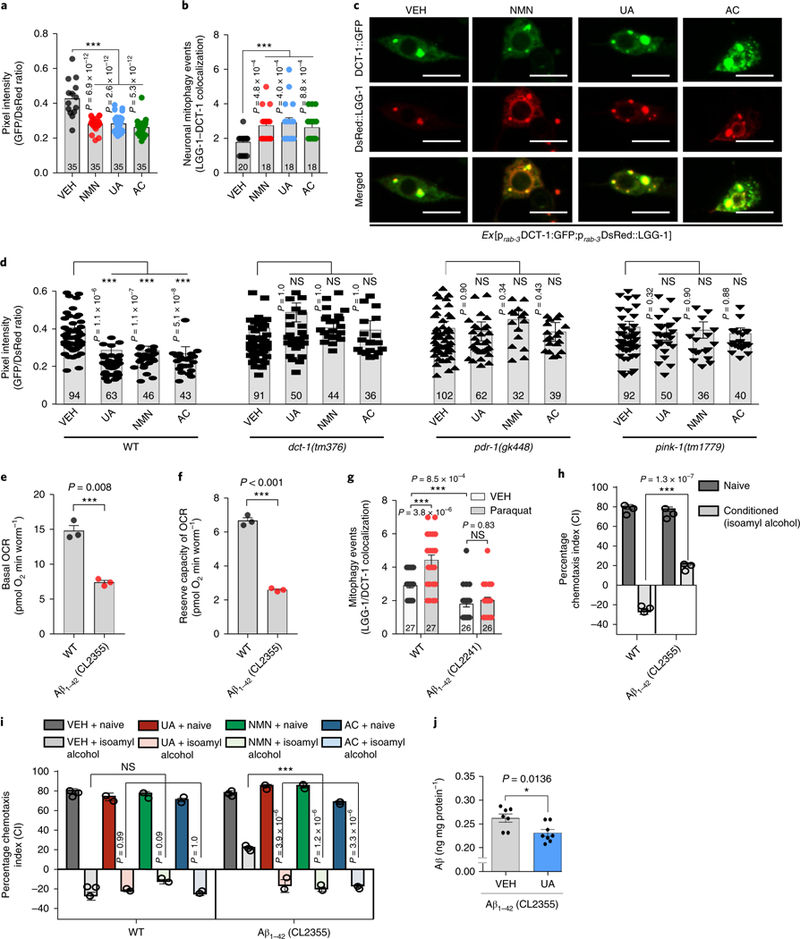
Fig. 2 |. Mitophagy induction restores memory in Aβ1–42 C. elegans model of AD.

a, Transgenic animals expressing the mtRosella biosensor in neuronal cells were treated with NMN, UA, and AC. Relative levels of neuronal mitophagy are expressed as the ratio between pH-sensitive GFP fluorescence intensity and pH-insensitive DsRed fluorescence intensity. The center value represents the mean and the error bars represent the s.e.m. (n = 35 nematodes per group; ***P < 0.001; one-way ANOVA followed by Šidák’s multiple-comparisons test). VEH, vehicle. b, Transgenic nematodes were treated with NMN, UA, and AC. Mitophagy events were calculated by the colocalization between the autophagic marker DsRed::LGG-1 and the mitophagy receptor DCT-1::GFP in neurons. The center value represents the mean and the error bars represent the s.e.m. (n = 18–20 neurons per group as detailed in the figure; ***P < 0.001; one-way ANOVA followed by Šidák’s multiple-comparisons test). c, Representative images of b; scale bars, 5 μm. d, Transgenic nematodes expressing the mtRosella biosensor in neuronal cells treated with NMN, UA, and AC. The decreased GFP/DsRed ratio of mtRosella indicates neuronal mitophagy stimulation. DCT-1, PDR-1, and PINK-1 were required for neuronal mitophagy induction in response to UA, NMN, and AC treatment. The center value represents mean and error bars represent s.e.m. (n = 32–102 nematodes per group as detailed in the figure; NS (not significant), P > 0.05, and ***P < 0.001; one-way ANOVA followed by Šidák’s multiple comparisons test). e,f, Nematodes expressing Aβ1–42 display decreased basal levels (e) and reserve capacity (f) of OCR. The center value represents the mean and the error bars represent the s.e.m. (n = 3 independent experiments; ***P < 0.001; two-sided Student’s t test). g, Mitophagy events were reduced in the neuronal cells of Aβ1–42-expressing nematodes under control and oxidative stress (paraquat/paraquat 8 mM) conditions. The center value represents the mean and the error bars represent the s.e.m. (n = 26–27 neurons per group as detailed in the figure; NS, P > 0.05 and ***P < 0.001; one-way ANOVA followed by Šidák’s multiple-comparisons test). h, Aversive conditioning (to isoamyl alcohol in the absence of food) is impaired in transgenic animals expressing Aβ1–42 (CL2355 strain) in neurons. The bars depict the chemotaxis indices toward isoamyl alcohol, monitored for either naïve or conditioned WT and Aβ1–42-expressing nematodes. The center value represents the mean and the error bars represent the s.e.m. (n = 400 nematodes per group; ***P < 0.001; two-way ANOVA followed by Tukey’s multiple-comparisons test). i, Dietary supplementation with UA, NMN, or AC improves associative memory in transgenic nematodes expressing Aβ1–42 (CL2355 strain). The bars depict the chemotaxis indices toward isoamyl alcohol, measured for either naïve or conditioned WT and Aβ1–42-expressing nematodes with or without UA, NMN, or AC treatment. The center value represents the mean and the error bars represent the s.e.m. (n = 400 nematodes per group; ***P < 0.001; two-way ANOVA followed by Tukey’s multiple-comparisons test). Experiments for the data in h and i were performed together and thus share the same data for the VEH groups. j. UA reduces Aβ peptides in CL2355 nematodes (day 5). The center value represents the mean and the error bars represent the s.e.m. (n = 7 biologically independent samples in the VEH group or 8 biologically independent samples in the UA-treated group; *P < 0.05; two-sided Student’s t-test). For all nematode experiments, two to four independent experiments were performed.
