
Fig. 4 |. Mitophagy induction promotes phagocytic activity of microglia and inhibits neuronal inflammation in APP/PS1 AD mice.
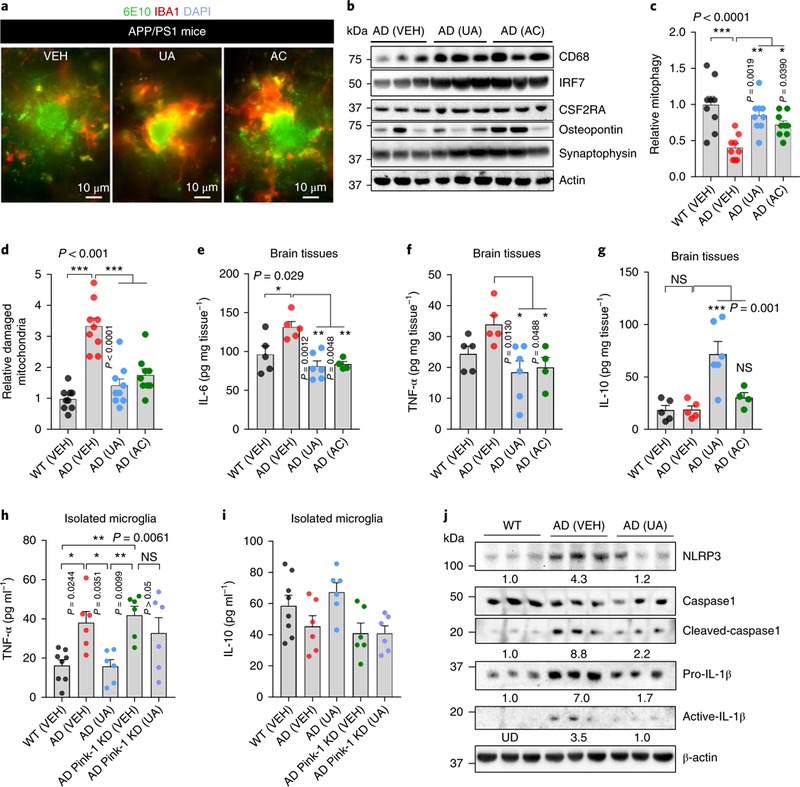
a, Representative images showing microglial cells engulfing or near Aβ plaques. Aβ plaques are shown in green (6E10 antibody) and microglia (anti-lbal antibody) are in red. b, Effects of UA and AC on the expression level of proteins involved in microglial phagocytosis and synaptic function in the hippocampus (n = 3 mice per group). c,d, Electron microscopy data show elevation of mitophagy-like events (c) and diminished mitochondrial damage (d) in response to UA and AC administration. The center value represents the mean and the error bars represent the s.e.m. (n = 3 mice per group; *P<0.05, **P<0.01, ***P< 0.001; one-way ANOVA). e-g, The levels of the indicated cytokines were altered on UA- and AC-induced mitophagy. The center value represents the mean and the error bars represent the s.e.m. (n = 5 mice in WT (VEH), n = 5 mice in AD (VEH), n = 6 in AD (UA), and n = 4 in AD (AC); NS, P> 0.05 and *P<0.05, **P< 0.01, ***P< 0.001; one-way ANOVA). h,i, UA inhibits inflammation in microglia isolated from APP/PS1 mice via PINK-1-dependent mitophagy. CD11b+, CD45low microglial cells were isolated from the brain tissue of WT and APP/PS1 mice through a FACS sorting system. Cells were then cultured to knock down Pink1, followed by the treatment of UA (50μM for 24h). Cytokines were detected using commercial ELISA kits. The center value represents the mean and the error bars represent the s.e.m. (n = 8 mice in the WT (VEH) group, or n = 6 in the other groups; *P< 0.05; one-way ANOVA). j, Western blot data showing the effects of UA on the expression levels of proteins involved in NLRP3 inflammasome activity and inflammation in the cortical tissue of the mice (n = 3 mice per group). Numbers inserted are the mean of the average protein level per 3 samples; UD, undetected. Tissues/cells from 8-month- old mice were used for the experiments. Full scans of all the blots are in the Supplementary Note.