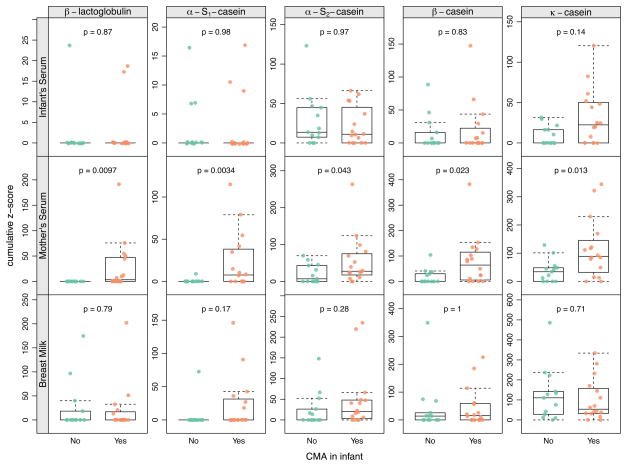
Figure 4.
Difference of IgA binding between dyads with and without CMA. Results are shown separately for cow’s milk protein and sample type. Boxes indicate the 25th and 75th percentile with a horizontal line at median. Whiskers indicate 5th and 95th percentile. P-values for group-wise comparisons are calculated using the Wilcoxon rank-sum test.

