
Figure 4.
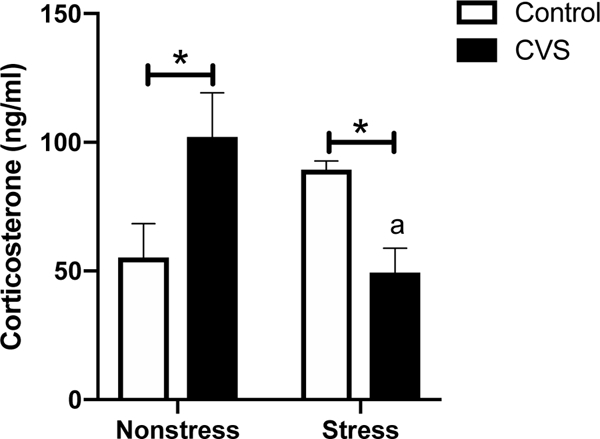
Evening (1700 h) plasma corticosterone levels after 20 minutes of restraint stress compared to nonstress values in chronic variable stress (CVS) and control females. Each bar represents the mean ± SEM of n=6–8 p/group. *=p<0.05 for control versus CVS females within each treatment group. a=p<0.01 for CVS nonstress verus CVS stress females.