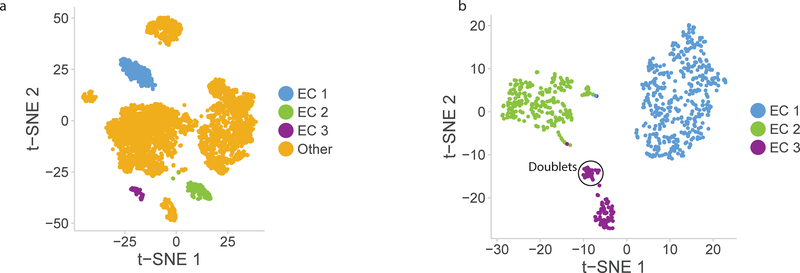
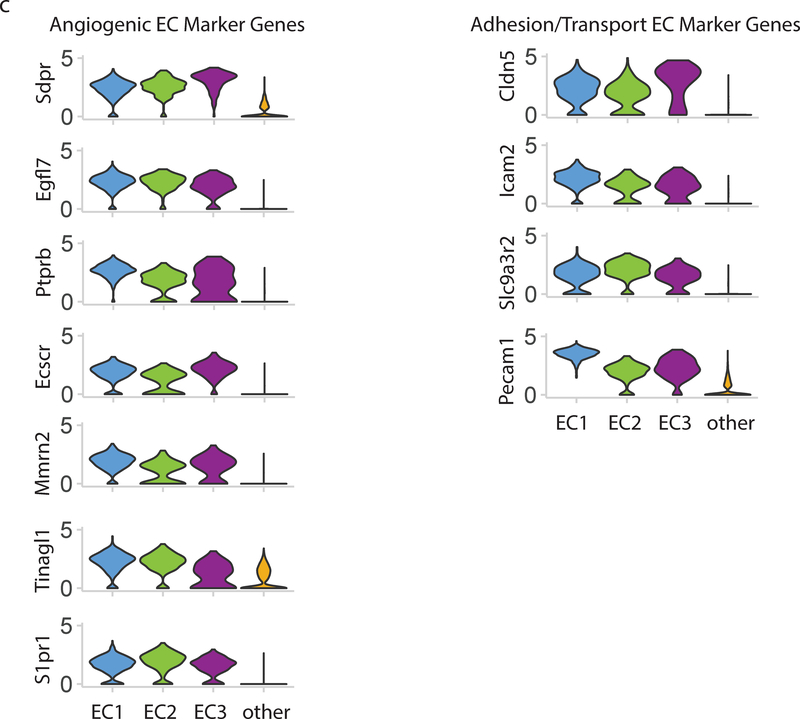
Figure 3:
Endothelial cells cluster into 3 distinct populations. a) t-SNE plot of EC subpopulations highlighted relative to other aortic cell types. The three EC subpopulations have distinct transcriptional profiles compared with each other and with all other aortic cells. b) t-SNE plot of all VE-Cadherin positive cells in mouse aorta. EC subpopulations were extracted from whole aorta data, and separately analyzed. In this t-SNE plot the 3 subpopulations are re-identified along with a small (5%) population of doublet cells which are an artifact of droplet-based single cell RNA-sequencing. c) Multiple genes show EC-specific expression and are expressed in all 3 EC subpopulations. Genetic markers expressed in all EC clusters compared with all other cells are divided into angiogenic EC marker genes and adhesion/transport EC marker genes. Violin plot y-axis demonstrates normalized transcript expression values.


