Figure 7:
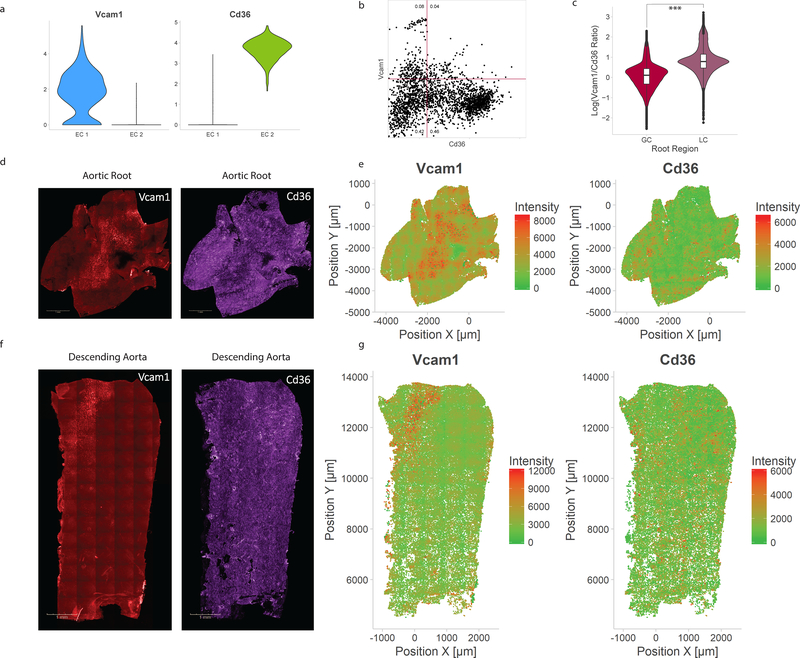
Histological correlates of identified EC subpopulations. a) Violin plot comparison of Vcam1, an EC 1-associated marker, and Cd36, an EC 2-associated marker. b) Flow cytometry of mouse aortic endothelial cells demonstrating heterogeneity corresponding to subpopulation markers, with both Vcam1+/Cd36− and Vcam1−/Cd36+ populations. Numbers indicate fraction of cells in each quadrant. c) Quantification of log-transformed Vcam1/Cd36 ratio in greater (GC) and lesser (LC) curvatures of aortic root. *** indicates Mann-Whitney U-test p-value < 0.001. d) Representative immunofluorescence microscopy images for Vcam1 and Cd36 in the aortic root. e) Quantification of Vcam1 fluorescence intensity and Cd36 fluorescence intensity in the aortic root. f) Representative immunofluorescence microscopy images for Vcam1 and Cd36 in the descending aorta. g) Quantification of Vcam1 fluorescence intensity and Cd36 fluorescence intensity in the descending aorta.

