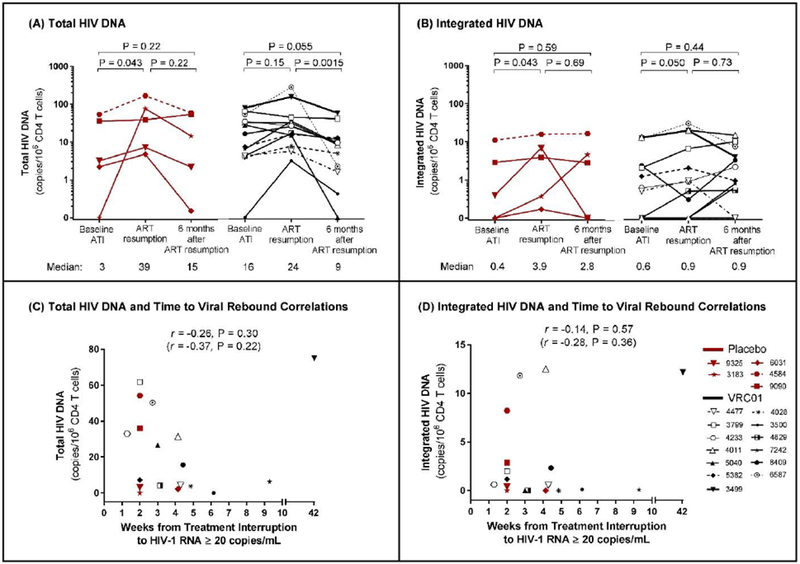
Figure 4. Total and Integrated HIV DNA.

The frequencies of CD4+ T-cells that harbor total (panel A) and integrated (panel B) HIV-1 DNA remained low in both the placebo (red) and VRC01 (black) arms throughout the period before, during, and after treatment interruption. Median values for the total and integrated HIV-1 DNA measurements for each arm and at each time point are reported below the x-axis. Viral rebound was associated with a small, transient increase in total and integrated HIV-1 DNA in the placebo group at the time of ART resmnption with a return at six months after ART resmnption to levels observed before analytic treatment interruption. There were no significant differences in total or integrated HIV-1 DNA between placebo and VRC01 recipients at any of the time points tested (all p>0⋅05). There was no statistically significant correlation (p<0⋅05) between total HIV-1 DNA (panel C) or integrated HIV-1 DNA (panel D) and time to HIV-1 RNA ≥20 copies per mL. Correlation analyses were repeated with only VRC01 recipients (r and p in parentheses).
