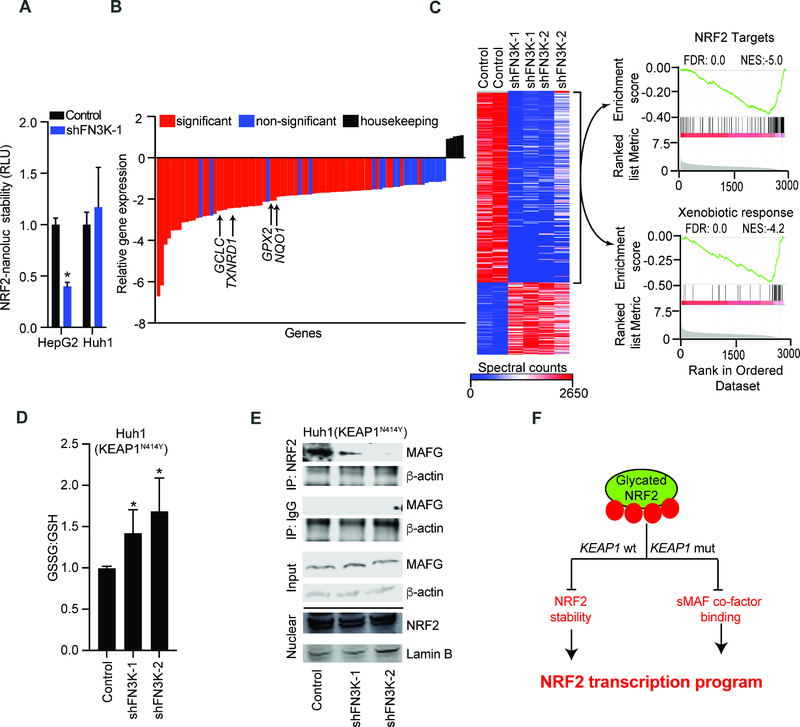
Figure 4: NRF2 glycation suppresses its oncogenic functions in KEAP1 wild type and mutant cell.
A) Measuring NRF2 stability using an NRF2-nanoluciferase fusion protein in lysates of KEAP1 proficient HepG2 and KEAP1 mutant Huh1 cells transduced with control or shRNA against FN3K; mean of n=6 for HepG2 and n=3 for Huh1 cells ± SD; B) Relative expression of ~80 antioxidative genes in KEAP1N414Y mutant Huh1 cells transduced with control or FN3K shRNAs; average of four replicates (n=2 for each FN3K-specific shRNAs) relative to control shRNA; C) Unsupervised clustering of total proteomics data from indicated Huh1 cell lysates; GSEA analysis of over- and underrepresented proteins in FN3K-deficient cells shows reduction of NRF2 target proteins (top) and proteins involved in xenobiotic metabolism (bottom); D) Luminescence-based quantification of oxidized and reduced glutathione in KEAP1N414Y Huh1 cells expressing control vector or shRNA against FN3K; error bar represents SD from n ≥ 5 replicates; E) Nuclear extracts from Huh1 cells with control vector or FN3K knockdown immunoprecipitated with NRF2 or IgG antibodies and probed for MAFG and β-actin; nuclear lysates (bottom) were loaded on a separate gel and probed with αNRF2 and αLamin B as indicated; F) Schematic of KEAP1-dependent and independent mechanisms of NRF2 inhibition by glycation. (*denotes two-tailed t test calculated p-value of <0.05). See also Figure S4 and Table S4.

