
Figure 5.
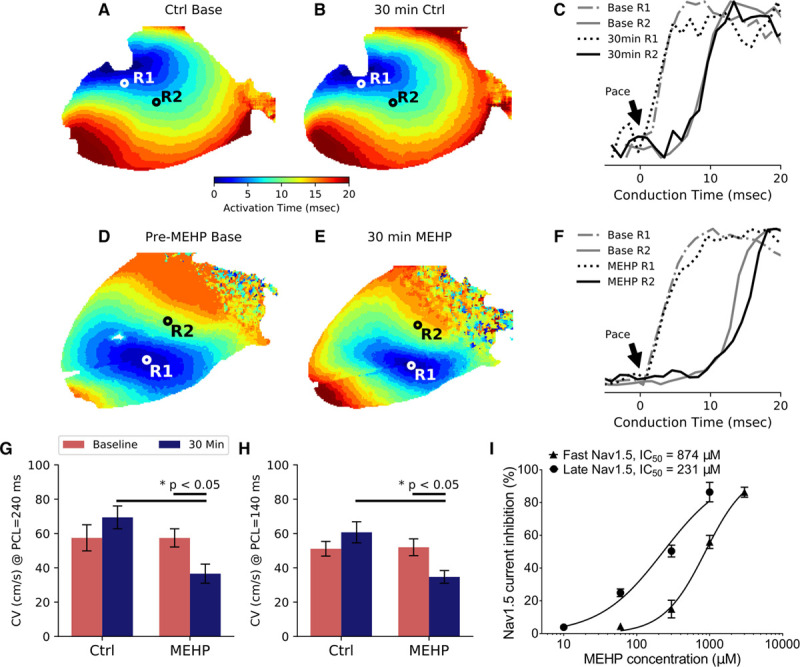
Activation maps and measured conduction velocity (CV) after mono-2-ethylhexyl phthalate (MEHP) exposure. A, Each pixel on the heart was assigned an activation time based on the maximum upstroke velocity in the fluorescent signal to create an isochrone map. Wavefronts are visible emanating from the center of the left ventricular epicardium where the cathodal pacing electrode was placed. B, After 30-min control (Ctrl)-media perfusion, the activation maps did not show significant differences. C, In Ctrl hearts, analysis of the pacing site (R1) and a distal site (R2) did not show significant differences in conduction time when compared between baseline and 30-min perfusion. D, Pre-MEHP baseline showed similar CV as the Ctrl baseline. E, After 30-min of MEHP exposure, the activation maps changed in morphology. F, Analysis of the pacing site (R1) and distal site (R2) indicated a decreased upstroke velocity after 30-min of MEHP exposure. G, CV was significantly slower in MEHP-treated hearts compared with Ctrls after 30 min at both pacing cycle length (PCL)=240 ms (P<0.05) and (H) PCL=140 ms (P<0.05), with N=5 per group. I, Sodium current (INa) was measured with HEK293 (human embryonic kidney 293) cells which stably express Nav1.5. Fast sodium current (INa) was measured in the absence of anemone toxin, and half-maximal inhibition concentration (IC50) was determined at 874 µmol/L. Late sodium current (INaL) was activated with anemone toxin, and corresponding IC50 was determined at 231 µmol/L (N=5 for each group).