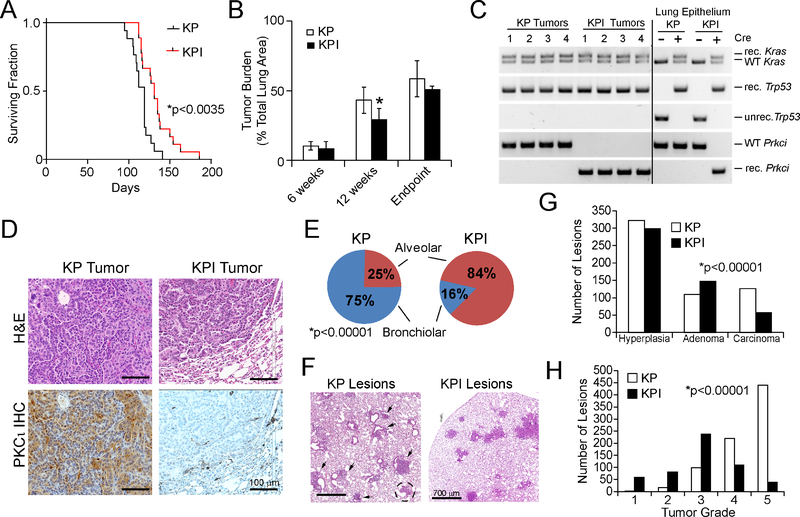
Figure 1. Effect of Prkci deletion on KP tumorigenesis.
(A)Effect of genetic loss of Prkci on survival of KP and KPI mice after Ad-Cre-induced LADC formation. *p<0.0035 between KPI and KP by Student’s t-test. n=17 (KP), n=33 (KPI).
(B) Tumor burden in KP and KPI mice at 6 weeks, 12 weeks and at endpoint after tumor induction. Tumor burden (tumor area/total lung area) is expressed as % Total Lung Area. Results represent the mean ± SD; n≥5; *p<0.05 by Student’s t-test.
(C) PCR of genomic DNA from KP and KPI mice for Cre-mediated recombination of LSL-KrasG12D, Trp53fl, and Prkcifl alleles. unrec.=unrecombined; rec.=recombined; WT, wild-type.
(D) Representative images of KP and KPI tumor tissue sections stained with hematoxylin and eosin (H&E; upper panels) or for PKCι by IHC (lower panels).
(E) Distribution of preneoplastic and malignant lung lesions in KP and KPI mice. *p<0.00001 by Chi-square.
(F) Representative H&E images of lung lesions in KP and KPI mice six weeks after tumor initiation. Arrowheads indicate bronchiolar lesions; dotted circle indicates alveolar lesion in KP mouse.
(G) Classification of lesions in KP and KPI mice six weeks after tumor initiation. Lesions were counted and classified pathologically as hyperplasia, adenoma or carcinoma. Data represent number of lesions of each grade. n=5 mice/genotype. *p<0.00001 by Chi-square.
(H) Tumor grade analysis of lung lesions in KP and KPI mice 12 weeks after tumor initiation. Data represent number of lesions of each grade. n=5 mice/genotype. p<0.00001 by Chi-square.

