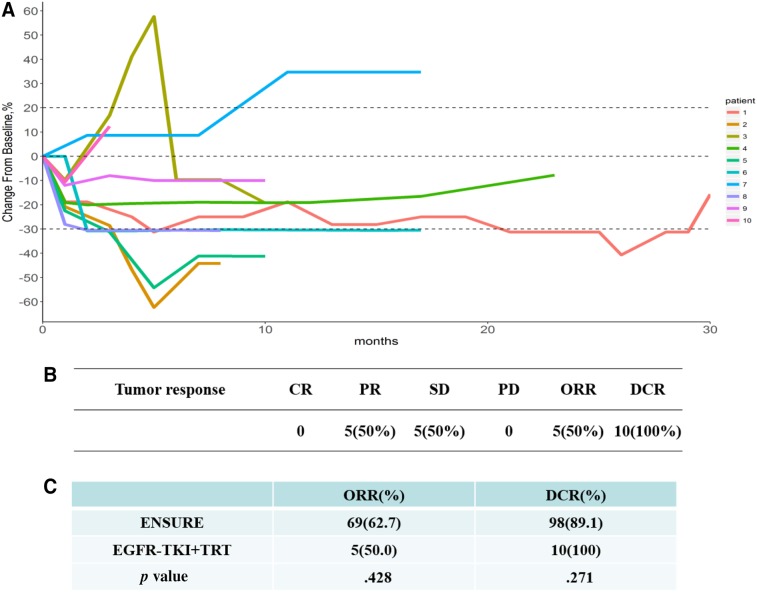
Figure 2.
Tumor response. (A): Spider plot of dynamic changes in the maximum diameter of the tumor. (B): Best tumor response. (C): Compared with the ENSURE study, there was no significant difference in ORR (50%, p = .43) or DCR (100%, p = .27). ORR = CR + PR; local control rate = CR + PR + SD.
Abbreviations: CR, complete response; DCR, disease control rate; ORR, objective response rate; PD, progressive disease; PR, partial response; SD, stable disease; TKI, tyrosine kinase inhibitor; TRT, thoracic radiotherapy.

