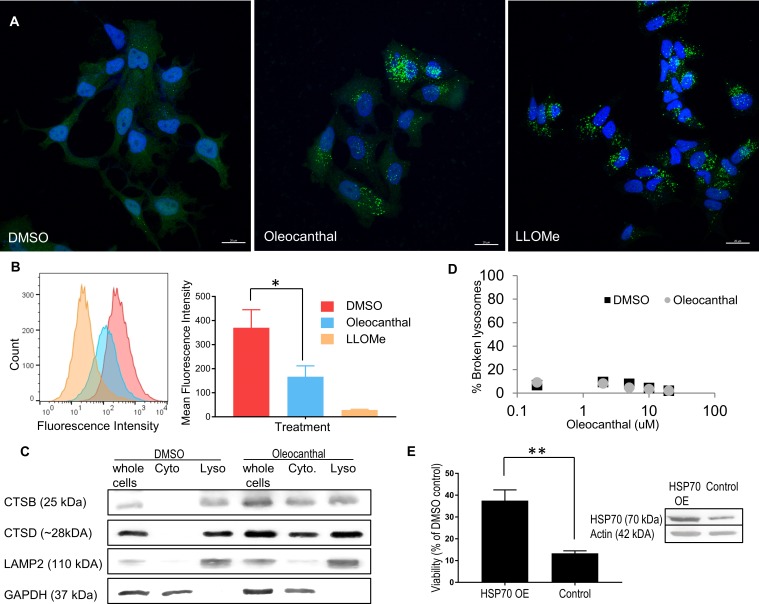
Fig 2. Oleocanthal induces LMP and cathepsin leakage.
(A) MCF-7 cells were treated with DMSO, 30μM oleocanthal for 2 hours, or 2 mM LLOMe and stained for Galectin-3. Nuclei were labeled with Hoechst 33,342. Scale bars 20 μM. Green Galectin punctea indicate compromised lysosomes. (B) PC3 cells were treated with 20 μM oleocanthal for one hour, or 2mM LLOMe for 15 minutes, then loaded with Lysotracker green. Fluorescence intensity was measured via flow cytometry. Histogram shows a representative shift in Lysotracker fluorescence associated with perturbation to the lysosomal compartment. Bar graph shows mean fluorescence intensity of three replicate experiments. (C) PC3 cells were treated with 20 μM oleocanthal, and two hours later their cytosolic fractions (Cyto), and light membrane fractions containing lysosomes (Lyso) were separated. Level of cathepsin B (CTSB) and cathepsin D (CTSD) in the various fractions or whole cell lysates is shown. LAMP2 is a lysosomal marker and GAPDH is a cytosolic marker. (D) Lysosomes isolated from overnight serum-deprived PC3 cells were incubated for 20 min with the indicated concentrations of oleocanthal or vehicle (DMSO). At the end of the incubation, lysosomes were filtered through a vacuum manifold and b-hexosaminidase activity was measured in the flow through and in the total lysosomal fraction. Broken lysosomes were calculated as the percentage of total lysosomal hexosaminidase activity detected in the flow-through and plotted in logarithmic scale. (E) PC3 cells were infected with HSP70-1 Lentiviral Activation Particles, or control (scrambled) particles, and treated with 20 μM oleocanthal. Viability was assayed using reduction of XTT. *P < 0.05, **P < 0.01 (Two-tailed unpaired t-test). Bar graphs represent the mean ± SEM (n = 3).

