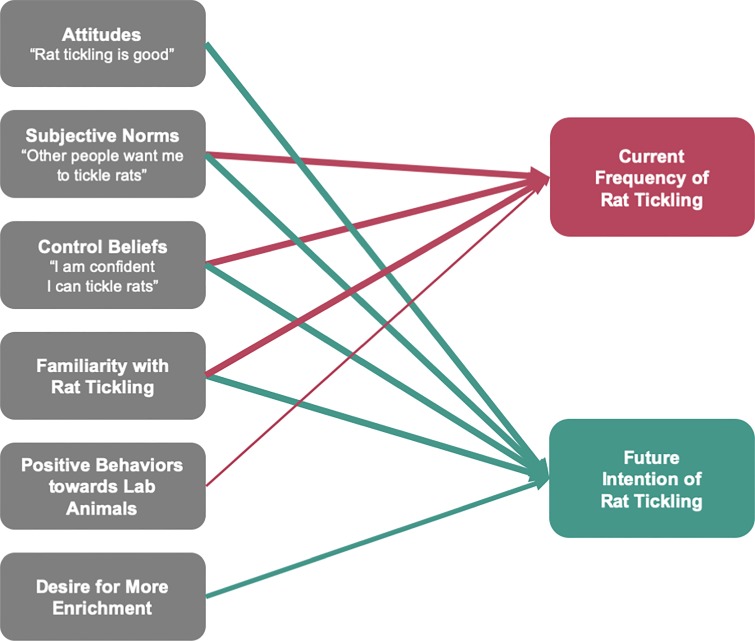
Fig 5. Significant associations between moderator factors and rat tickling implementation.
This figure shows significant associations from self-report data from laboratory animal personnel about potential moderating factors and both current (top, N = 591) and future (bottom, N = 656) rat tickling. Lines only connect between significant associations. The thickness of the lines indicates the significance of association (thick = p < 0.0001, medium = p < 0.001, thin = p < 0.05). Non-significant moderators included positive and negative Rattitude and control over enrichment. Models were run controlling for age, years working, hours of work per week, % of time working with rats, gender, role, institution, research type, race, and highest education (none which were significant). Numerical data is reported in S7 Table.

