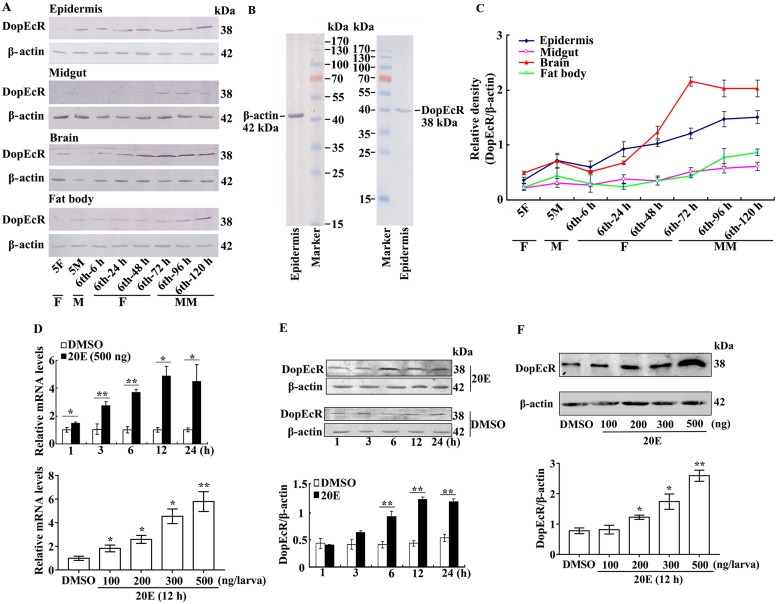
Fig 1. Expression profiles of DopEcR by western blot analysis and 20E upregulates DopEcR expression.
A. Expression profiles of DopEcR detected by anti-DopEcR antibody as the method description. β-actin as control. B. Specificity analysis of the antibodies against DopEcR and β-actin by western blotting with epidermis protein of 6th-72 h larvae. SDS-PAGE gel in western blot is 12.5%. C. Quantification of the data in A by ImageJ. Error bars indicate the mean ± standard deviations (SD) of three times repetition. D. qRT-PCR analysis of 20E regulation on DopEcR mRNA in larval head by time and dose. Equal volume of diluted DMSO was injected as control. The relative mRNA level was counted by 2–ΔΔCT. E. and F. Western blot analysis of 20E regulation on DopEcR in larvae head as the treatment in D. SDS-PAGE gel in western blot is 12.5%. β-actin was detected as control. Statistical analyses of C and D by Student’s t test and ImageJ. Error bars showed the mean ± SD of three times repetition. Asterisks manifest significant differences by Student’s t test (*p < 0.05; **p < 0.01).

