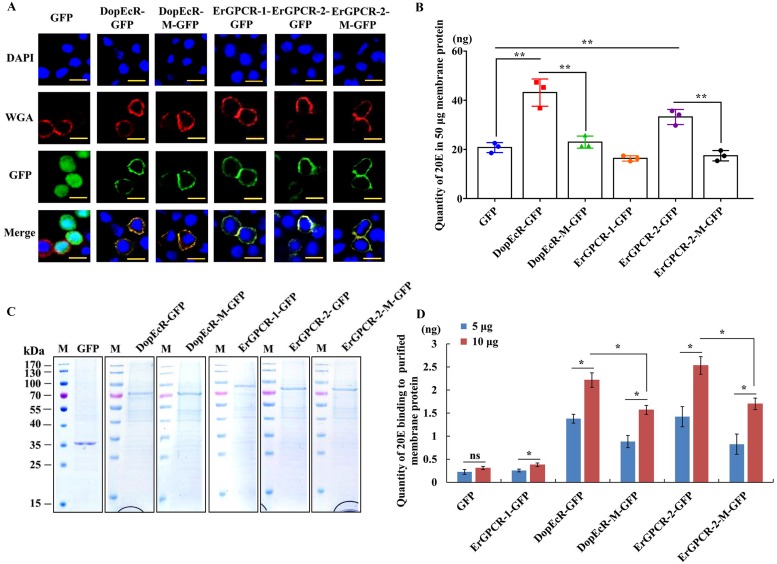
Fig 9. Detection of 20E that was bound by the GPCRs-overexpressing cell membrane proteins and the isolated GPCRs.
A. Cell membrane localization of overexpressed GFP and GPCRs. Red: the cell membrane was marked by wheat germ agglutinin (WGA). Green: green fluorescence from GFP and various GPCRs fused with GFP. Blue: nucleus stained with 4’-6-diamidino-2-phenylindole dihydrochloride (DAPI). Observed by confocal microscope. Scale bar = 20 μm. B. Quantity of 20E bound by 50 μg membrane proteins from HaEpi cells that was overexpressing GFP, DopEcR-GFP, DopEcR-M-GFP, ErGPCR-1-GFP, ErGPCR-2-GFP, and ErGPCR-2-M-GFP. C. SDS-PAGE shows the partially purified GPCRs with Coomassie brilliant blue staining used in the experiments in D. D. Quantity of 20E bound by DopEcR-GFP, DopEcR-M-GFP, ErGPCR-2-GFP, and ErGPCR-2-M-GFP. Error bars represent the SD of three replicates. Asterisks indicate significant differences according to Student’s t-tests (*p < 0.05; **p < 0.01).

