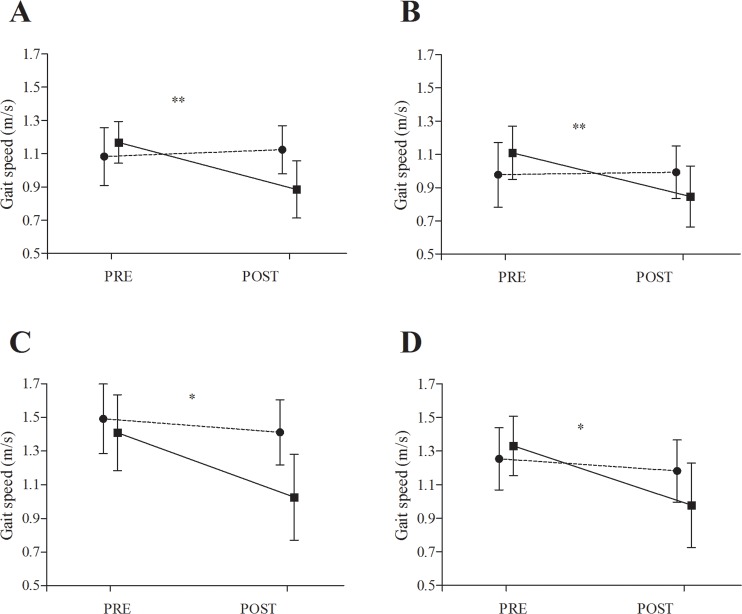
Fig 2.
Illustration showing gait speed results during walking in: a) self-selected pace under single-task condition; b) self-selected pace under dual-task condition; c) brisk-pace under single-task condition and d) brisk-pace under dual-task condition. Data are presented as means and standard deviations. * indicates a significant change of p< 0.05; ** indicates a significant change of p< 0.01 from PRE to POST, respectively.

