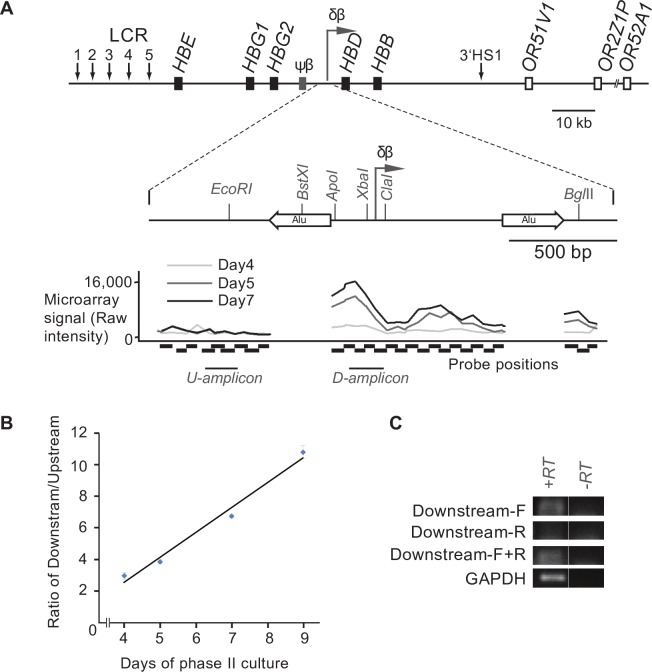
Fig 2. Analysis of transcription in the δβ intergenic promoter region in human erythroid cells.
(A) Schematic diagram of the human β-globin locus and the δβ intergenic promoter region. Black boxes represent globin genes; grey box corresponds to the β-like pseudogene, open boxes correspond to olfactory receptor genes flanking the β-globin locus. Vertical arrows indicate DNase hypersensitive sites, including sites 1 to 5 of the locus control region (LCR); horizontal arrows denote putative intergenic transcription start sites. The detailed map of the δβ promoter region shows the positions of the intergenic transcription start site and upstream Alu element (left horizontal open arrow). Restriction enzyme sites are indicated by vertical lines. The graph below the δβ intergenic promoter schematic indicates microarray signal intensity for various probes (indicated under the graph with horizontal black boxes) following labelling and hybridisation of RNA extracted from primary erythroid cells at different phases (day 4 in light grey, day 5 in dark grey and day 7 in black) of phase II culture. The results shown are representative of five biological replicates (B) The RNA samples used for microarray analysis in A were converted into cDNA using a WTA kit and amplified by PCR. The PCR amplicons are indicated beneath the microarray signal graph as U (upstream) amplicon and D (downstream) amplicon. The amounts of each amplicon were calculated by comparing signals to a standard curve generated with genomic DNA and the ratio of downstream over upstream was calculated. The ratio increases through phase II indicating a relative increase in transcripts downstream of the putative intergenic promoter. Results are representative of two biological replicates. Pearson correlation analysis indicates a statistically significant correlation (p<0.01). (C) RNA from day 7 of erythroid differentiation was converted into cDNA using either gene-specific primer (the downstream-amplicon forward primer [Downstream-F], the downstream-amplicon reverse primer [Downstream-R] or a combination of the two primers [Downstream-F+R] as indicated to the left of each panel). PCR was then carried out using both Downstream-F and Downstream-R primers (to amplify the downstream amplicon). GAPDH primers were used as a control to confirm RNA integrity. PCR products were run on a 2% gel, stained with SYBR Gold, and visualised on a Typhoon Imager. The strand-specific results show that the transcripts detected downstream of the δβ intergenic promoter are sense transcripts (travelling towards HBD).

