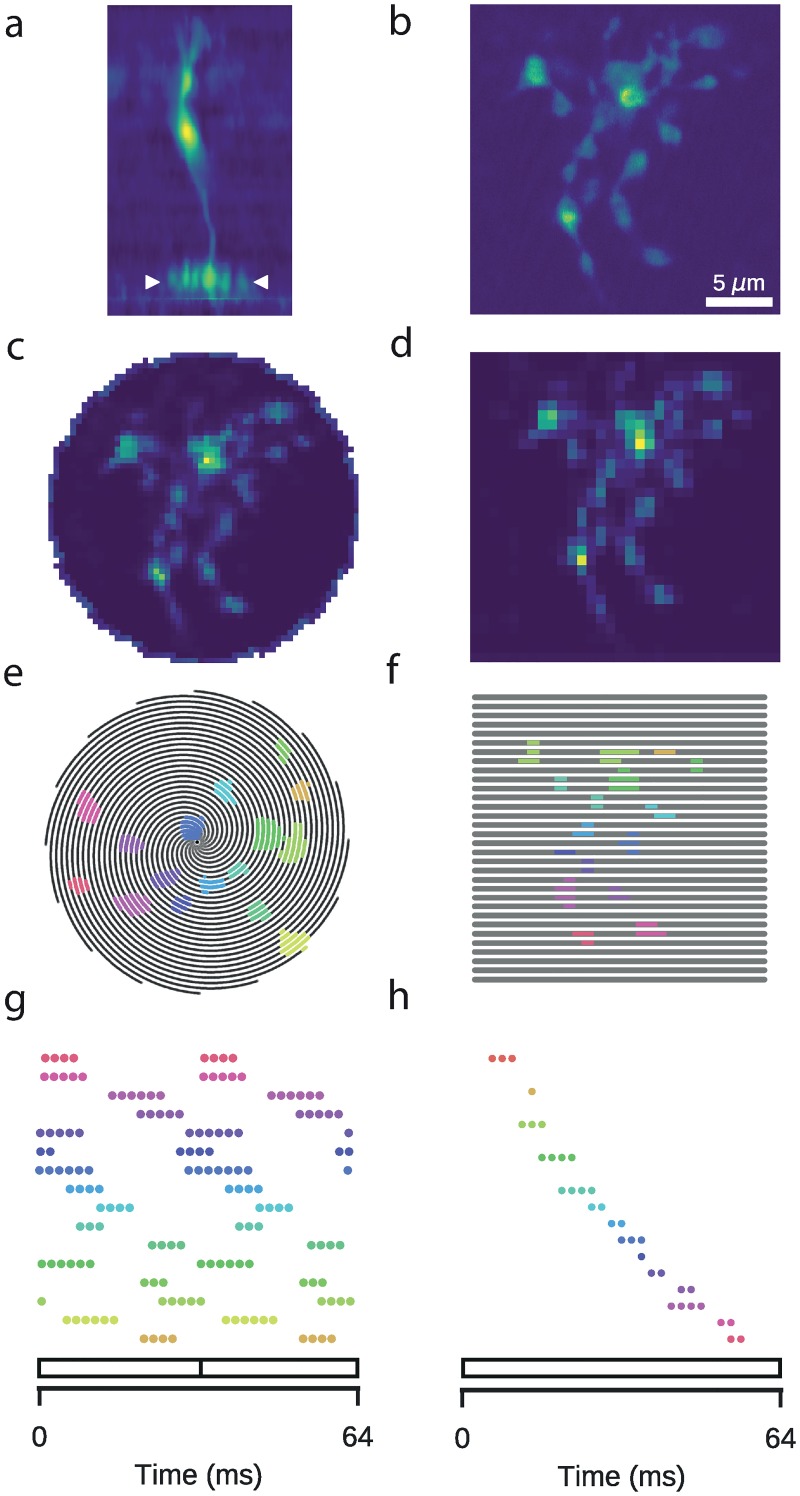
Fig 1. Two-photon imaging of retinal neurons.
Data: Retinal bipolar cell filled with OGB-1 via sharp electrode injection and recorded using linear and spiral scan configurations. a: Vertical profile. Image coloured according to fluorescence intensity (yellow: high, blue: low). b: Horizontal (x-y), high-resolution scan of axon terminal system (512 x 512 pixels), corresponding to the domain between the two white ticks in (a). c: Spiral scan of axon terminal system (16 spirals; 31.25 Hz), as above. d: Linear scan of axon terminal system (32 lines; 15.625 Hz), as above. e: Spiral scan trajectory with ROI mask superimposed. Black lines indicate scan trajectory. Colours correspond to discrete ROIs. f: As (e), but with a linear scan configuration. The same ROIs were used. g: Time points at which the scan trajectory intersects with the ROI mask in (e). 64 ms span corresponds to two spiral scan frames. h: As (g), but for a linear scan configuration. ROIs correspond to those in (f). 64 ms span corresponds to one linear scan frame.

