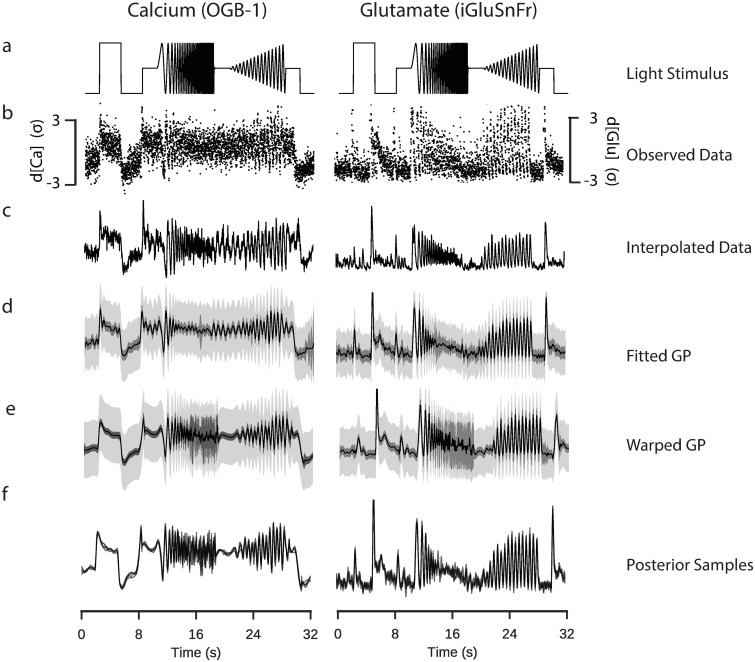
Fig 2. Inference of signals from two-photon data.
Data: ROI from a retinal bipolar cell filled with OGB-1 via sharp electrode injection (left), and a different ROI from a scan field with bipolar cell terminals in a retina expressing iGluSnFR (right); both recorded using spiral scan configurations. Model: RBF kernel, 300 inducing inputs, 25 iterations per fit, best of 6 fits per model. a: “Full-field chirp” light stimulus, consisting of a light step, a frequency-modulated sine wave and a contrast-modulated sine wave. b: Observed activity of a single ROI. Each point corresponds to the mean activity of the ROI in a single scan line. The time at which the point was recorded is defined relative to the start of each stimulus trial, such that each trial leads to at least one data point for every time the laser scans across a given ROI. Information regarding the trial from which the point was derived is not explicitly incorporated into the model. c: Estimate of underlying signal from frame averaging, cubic spline interpolation and averaging over trials. This corresponds to the typical approach used in previous papers [7]. d: Fitted sparse Gaussian process. Black line indicates the mean signal. Intervals indicate uncertainty of the signal with and without the observation noise (light and dark grey, respectively), to 3 standard deviations. e: Fitted sparse warped Gaussian process. Input warping uses the warping function shown in the following figure. Model has been projected back onto the original time dimension. f: Five posterior samples drawn from the fitted sparse warped Gaussian process models.

