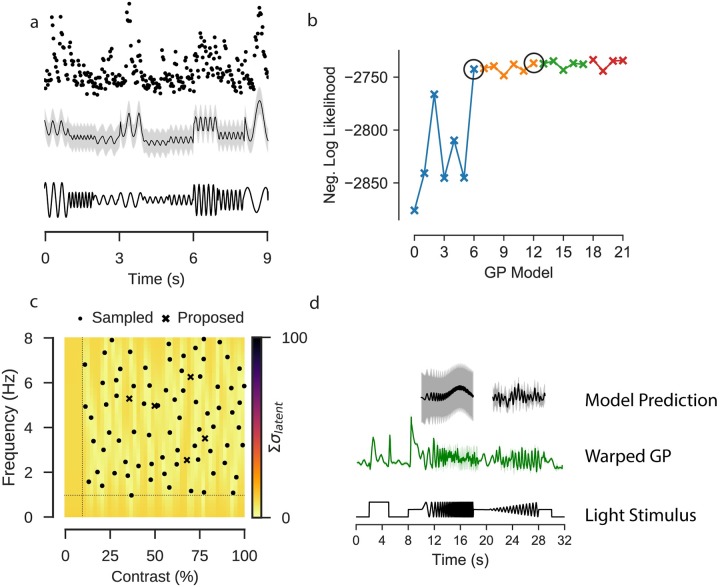
Fig 6. Extended GP model incorporating stimulus parameters.
Data: ROI from a scan field with bipolar cell terminals in a retina expressing iGluSnFR, recorded using a spiral scan configuration. Model: Product of RBF kernel (time) with composite RBF kernels (frequency and contrast), 500 inducing inputs, 50 iterations per fit, best of 5 fits per model. a: Observed activity of one ROI filled with OGB-1 (top); GP model selected by model selection procedure, conditioned on the observations of the ROI. Sine stimulus activity. Data corresponds to the first 9s of the stimulus. b: Negative log likelihood for each model tested during model selection. Each point corresponds to a single model, where the kernel consists of the effects adopted in the previous pass, with an additional effect being evaluated, which will be included if it has the highest negative log likelihood. Each “Pass” corresponds to an exhaustive evaluation of all possible effects to add to the current kernel. The best performing model in each pass is highlighted with a black circle. c: Locations in frequency-contrast parameter space selected for the stimulation. Colour map corresponds to the sum of the variance of the latent function for the fitted GP model evaluated under each parameter combination. Crosses correspond to peaks in the uncertainty where the stimulus should next be evaluated. Dashed line indicates the limits of the space from which the parameters were sampled. d: GP fitted to observed chirp responses for the same ROI (middle). Prediction of the activity by the model on the sine stimulus data (top).

