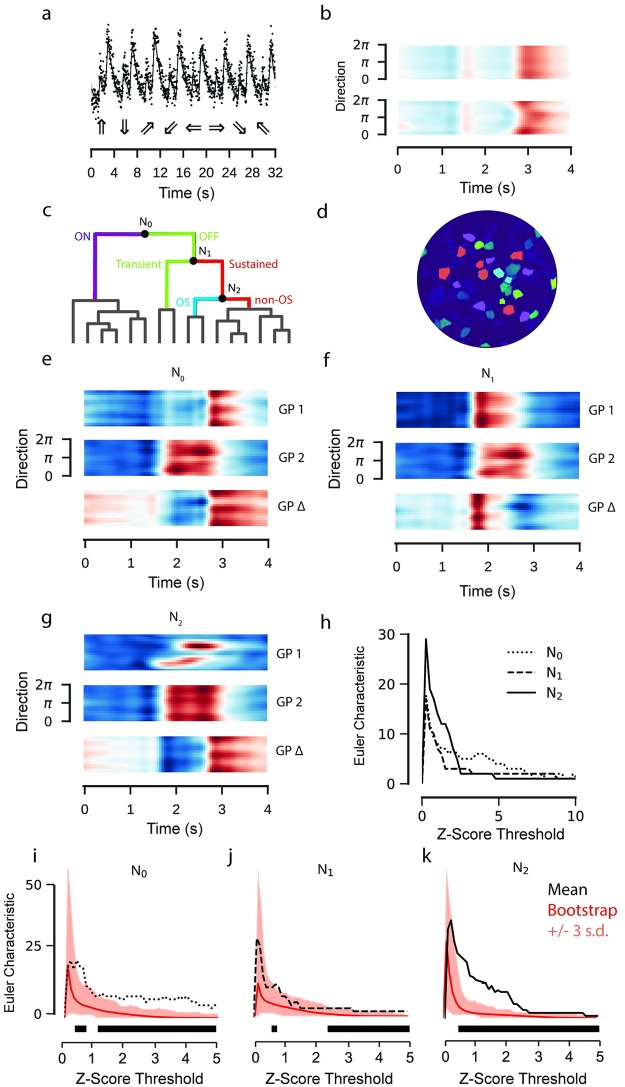
Fig 8. GP model of retinal ganglion cell responses to a moving bar stimulus.
Data: ROIs from a field of RGC somata labelled with OGB-1 using electroporation, recorded using a spiral scan configuration. Model: Product of RBF kernel (time) with composite RBF kernel (direction), 300 inducing inputs, 25 iterations per fit, best of 3 fits per model. a: Observed activity of one ROI representing an RGC soma labelled with OGB-1 (top). GP model superimposed. Intervals correspond to the variance of the latent function, 3 standard deviations above and below the mean. Below are the moving bar directions for each trial. b: GP model fitted to data in (a) without (top) and with (bottom) interaction kernel. Both models include additive effects for direction and time. Coloured according to response amplitude (red: high, blue: low). c: Hierarchical clustering of fitted models. Colours on dendrogram correspond to colours on ROI mask. Posterior means for each ROI in each cluster are shown in S2 Fig. d: ROI mask with cluster colours for k = 4 corresponding to clustering in (c). A baseline s.d. was computed from the 500 ms of activity preceding the light step. ROIs where the amplitude of the step response was less than 2 s.d. greater or lower than the mean signal were excluded. e, f, g: GP Equality Tests for each node. Top and middle correspond to the two putative clusters, bottom is the mean difference between them. h: Euler Characteristic as a function of the number of standard deviations above and below the respective mean functions, for each node. i, j, k: Euler Characteristics (EC) from difference tests at the first three nodes, with bootstrap estimates of the null distribution of the EC superimposed. The mean of the null distributed shown in red. Intervals correspond to three standard deviations above and below the mean of the null distribution. The black bar indicates the thresholds where the EC from the difference test exceeds the highest estimate from the null distribution by three standard deviations.

