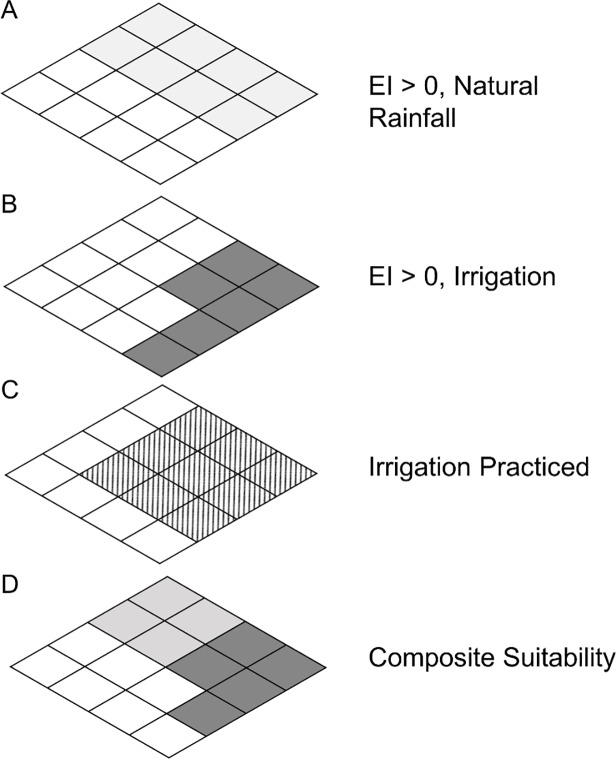
Fig 1. Mapping composite climate suitability.
(A) Shaded areas are suitable under a natural rainfall scenario; (B) shaded areas are suitable under an irrigation scenario; (C) hatched areas are identified irrigation areas [33]; (D) composite climate suitability is calculated as the maximum EI values of shaded areas in (A), and shaded areas in (B) where irrigation is practiced [hatched areas in (C)].

