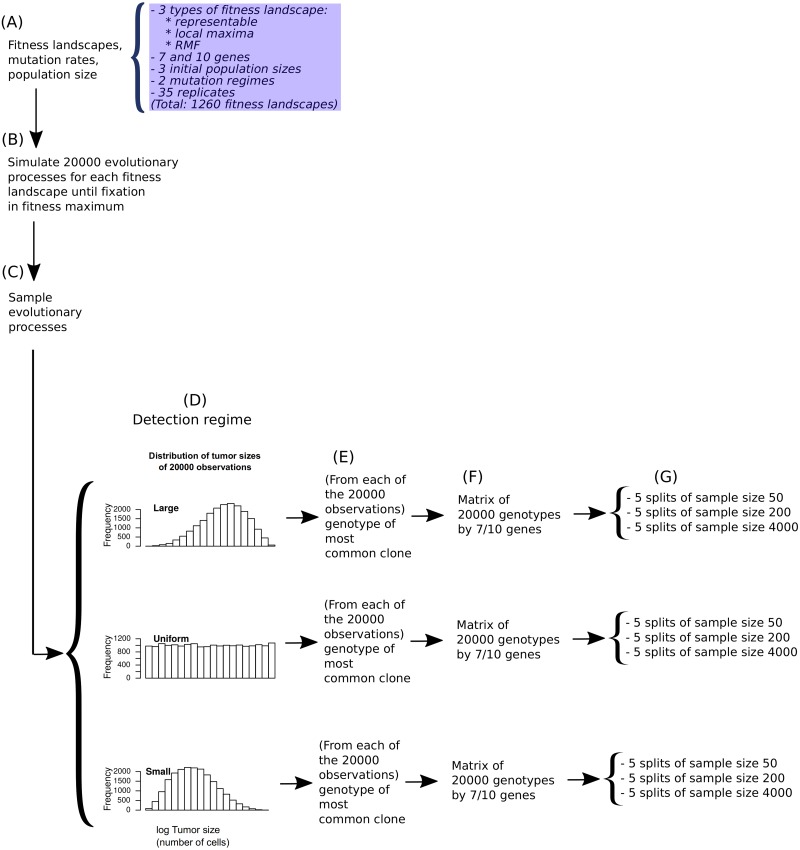
Fig 2. Scheme of the simulation study.
(A) On each of the 1260 fitness landscapes, (B) 20000 evolutionary processes were simulated. The set of 20000 evolutionary processes from a fitness landscape were then (C) sampled under three detection regimes, obtaining one observation per simulation under each detection regime, (D) leading to 20000 observations that are enriched in large-sized tumors —large detection regime—, 20000 observations enriched on small-sized tumors —small detection regime—, and 20000 observations with uniform distribution with respect to the logarithm of tumor size (so that the large and small detection regimes emulates cases when cancer tends to be detected at late or early stages, respectively —see text). (E) From each of the individual observations, we obtained the genotype of the most common clone; therefore, (F) each fitness landscape provides 3 sets of 20000 genotypes, one for each detection regime. (G) These sets were split in 5 non-overlapping sets of 50 observations, 5 non-overlapping sets of 200 observations, and 5 non-overlapping sets of 4000 observations. Each of these data sets was analyzed with each of the CPMs considered to obtain the predicted paths of tumor progression.

