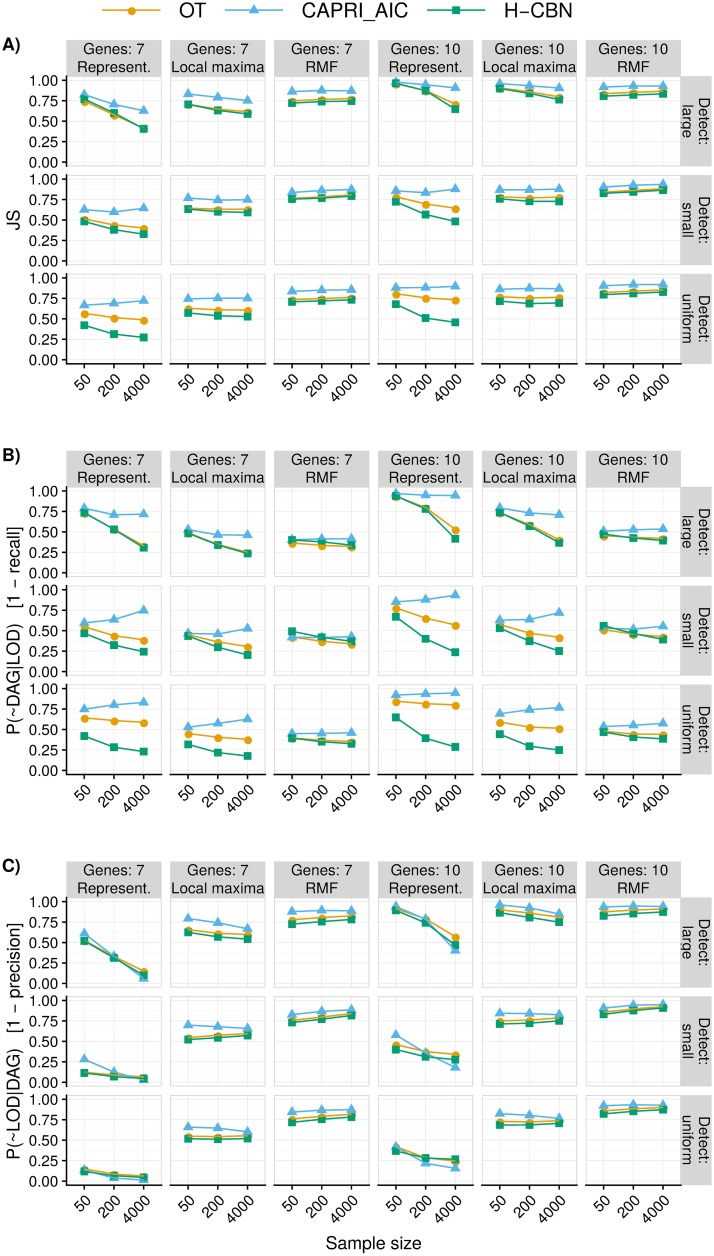
Fig 3. Summary performance measures (see definitions in Measures of performance and predictability) for OT, CAPRI_AIC, and H-CBN for all combinations of sample size, type of landscape, detection regime, and number of genes.
(A) Jensen-Shannon divergence (JS); (B) 1—recall; (C) 1—precision. For all measures, smaller is better. For OT and H-CBN, JS (panel A) and 1-precision (panel C) use probability-weighted paths (see text). Each point represented is the average of 210 points (35 replicates of each one of the six combinations of 3 initial size by 2 mutation rate regimes —see Overview of the simulation study); we are thus marginalizing over mutation rate by initial simulation size combinations. Each one of the 210 points is, itself, the average of five runs on different partitions of the simulated data. See Figure A in S6 Text for results for all six procedures used (four, two with two variants: H-CBN, MCCBN, OT, CAPRI_AIC, CAPRI_BIC, and CAPRESE).

