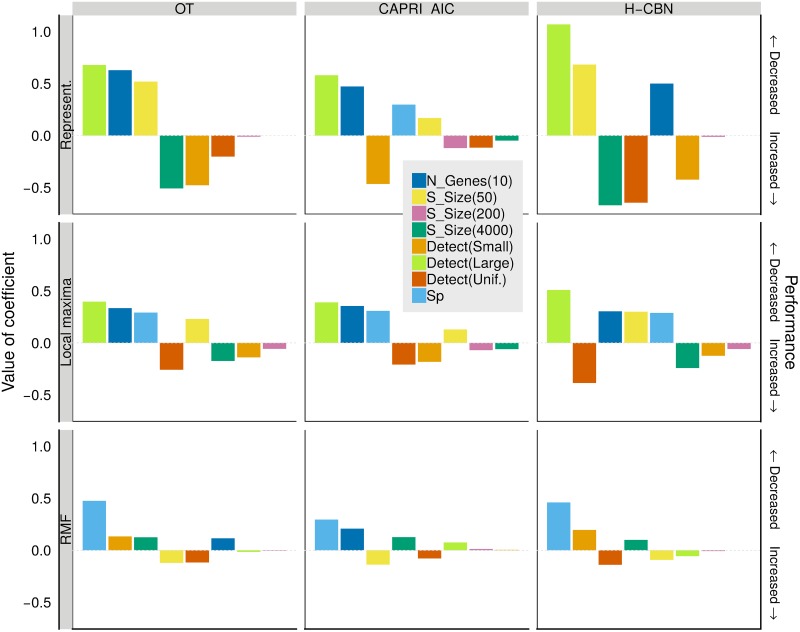
Fig 4. Coefficients from generalized linear mixed-effects models, for JS as dependent variable, with separate models fitted to each combination of CPM and type of fitness landscape.
Coefficients are from models with sum-to-zero contrasts (see text and Section 6 in S4 Text). Within each panel, coefficients have been ordered from left to right according to decreasing absolute value of coefficient. The dotted horizontal gray line indicates 0 (i.e. no effect). Coefficients with a large positive value indicate factors that lead to a large decrease in performance (increase in JS). Only coefficients that correspond to a term with a P-value <0.05 in Type II Wald chi-square tests are shown. The coefficient that corresponds to Number of genes 7 is not shown (as it is minus the coefficient for 10 genes —from using sum-to-zero contrasts). “N_Genes”: number of genes; “S_Size”: sample size; “Detect”: detection regime; “Sp”: LOD diversity (Sp).

