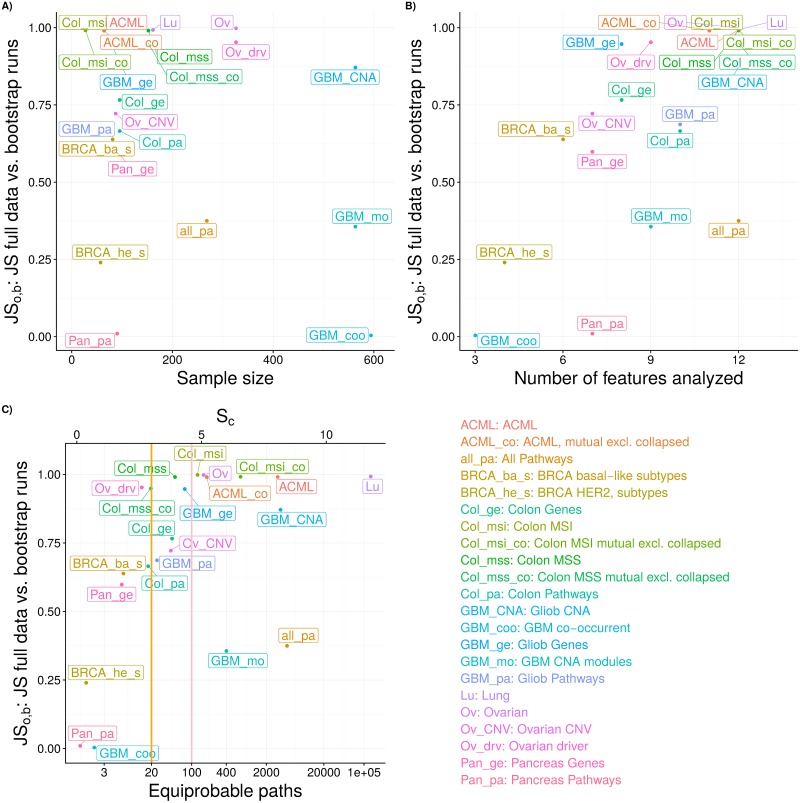
Fig 7. Summary patterns for JSo,b (average JS for the full data compared to the bootstrap runs) and unpredictability for the cancer data sets.
(A) JSo,b vs. sample size of data sets. (B) JSo,b vs. number of features analyzed for each data set. (C) JSo,b vs. estimated evolutionary unpredictability; in the bottom x-axis, Sc is shown in terms of number of equiprobable paths; orange and salmon vertical lines indicate 20 and 100 equiprobable paths, respectively. All results shown are from analysis with up to 12 features. Values shown for JSob are the average of the 100 bootstrap runs; values for unpredictability (Sc or equiprobable paths) are from the analysis with the original, non-bootstrapped, data.

