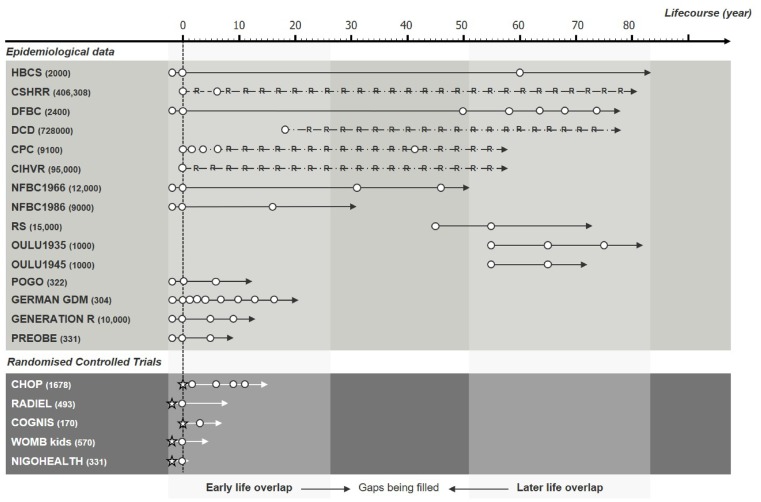
Figure 4.
DynaHEALTH datasets by size (in brackets), type, length and timing across the life-course, from the oldest study (top) to the youngest (bottom), separately for epidemiological longitudinal data and randomized controlled trials. White circles represent follow-up points, stars represent implementation of intervention and ‘R’ represents register-based datasets. Abbreviations are given in Table 1. (Reproduced from https://www.dynahealth.eu/ with permission).

