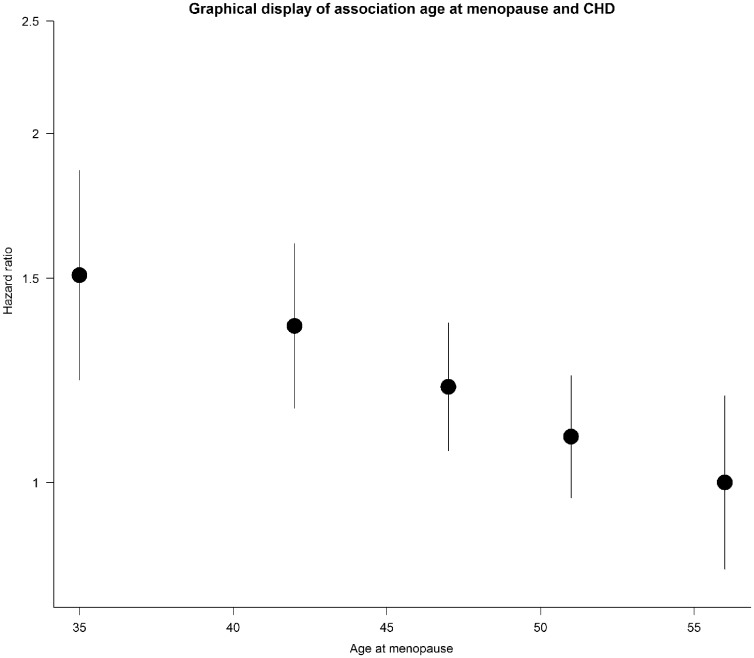
Figure 1.
Graphical display of the linear relationship between age at menopause and CHD using floating absolute risks to display the hazard ratios (HRs) for age at menopause categories [<40, 40–44, 45–49, 50–54, ≥55 years (reference), with 364, 551, 1284, 1563, 312 CHD events, respectively]. HRs were plotted against the mean age at menopause of each category, which are 34, 42, 47, 51 and 57 accordingly.

