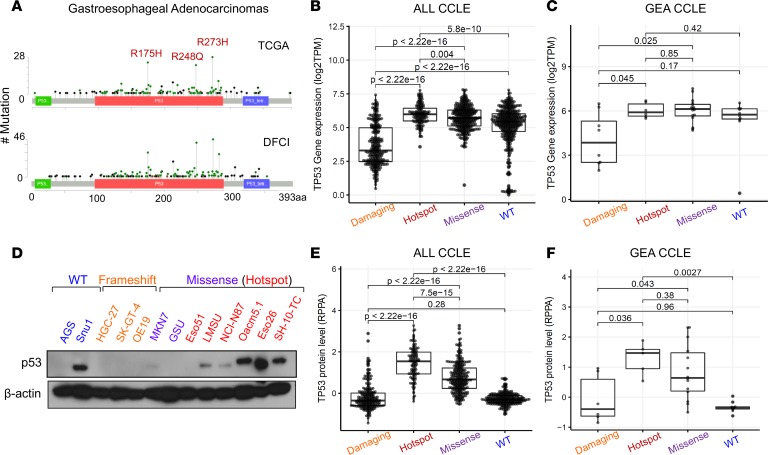
Figure 1. p53 is frequently mutated and overexpressed in human gastroesophageal cancer.
(A) Mutation plots of p53 derived from patients with gastroesophageal cancers collected through TCGA (top) and the DFCI (bottom). Box plot showing mRNA expression of TP53 across (B) all and (C) gastroesophageal cell lines found in the CCLE annotated by type of p53 mutation (damaging: nonsense and frameshift, n = 274 and n = 8; hotspot: R175H, R248Q/W, and R273C/H, n = 133 and n = 6; missense: all other missense excluding hotspot mutations, n = 331 and n = 16; WT: n = 394 and n = 10). P values are from pairwise Wilcoxon’s rank-sum tests. (D) Immunoblot analysis showing protein expression levels of p53 across various gastroesophageal cells lines annotated by p53 mutation status. (E and F) Box plot showing protein expression of p53 (RPPA data) across (E) all and (F) gastroesophageal cell lines found in CCLE annotated by p53 mutation status (damaging: n = 231 and n = 6; hotspot, n = 114 and 5; missense, n = 278 and n = 14; WT, n = 263 and n = 10. Lines within boxes represent median, the bounds of the boxes represent the 25th and 75th percentiles, and the whiskers extend to the lowest/largest values within 1.5 IQR from the lower and upper quartiles, respectively. P values were calculated by Wilcoxon’s rank-sum test.

