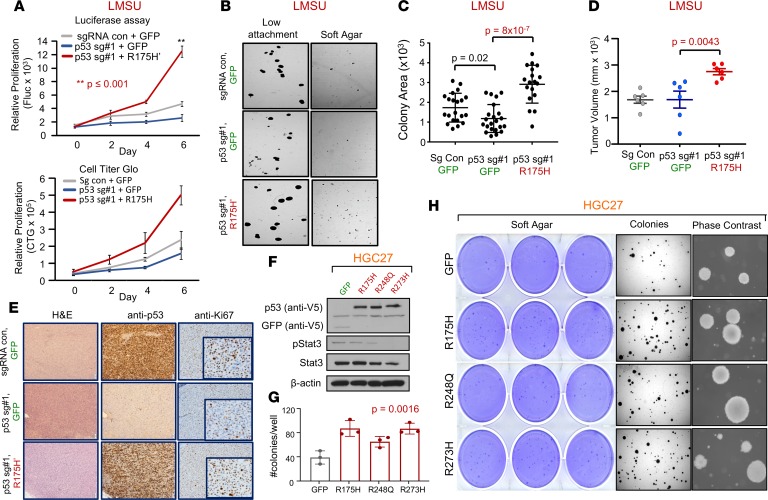
Figure 3. Enforced expression of mutant p53 in 2 gastric adenocarcinoma cell lines confers a growth advantage.
(A) Proliferation of control (sgRNA con + GFP), p53-KO (p53 sg#1 + GFP), and p53 KO-R175H′ rescue (p53 sg#1 + R175H′) LMSU cells using a firefly luciferase assay (Fluc; top panel) and CellTiter-Glo (CTG; bottom panel). **P ≤ 0.001. (B) Low-attachment and soft agar colony formation assays of control, p53-KO, and p53 KO-R175H′ rescue LMSU cells. (C) Quantification of low-attachment colony formation assay described in B. (D) Primary tumor growth of flank xenografts of control, p53 KO, and p53 KO-R175H′ rescue LMSU cells at 6 weeks. P values were calculated by Student’s t test. (E) p53 IHC of xenografts described in D at the endpoint. (F) Immunoblot showing expression of GFP control or indicated mutant p53 in the genetically engineered HGC27 gastric cancer line (p53 null). (G) Quantification of soft agar colonies of HGC27 gastric cancer cell line expressing GFP control or the indicated p53 mutant. P value was calculated by 1-way ANOVA. (H) Crystal violet, dissection microscope, and phase-contrast images of soft agar colonies of the HGC27 gastric cancer cell line expressing GFP control or the indicated p53 mutant. All data are mean ± SD.

