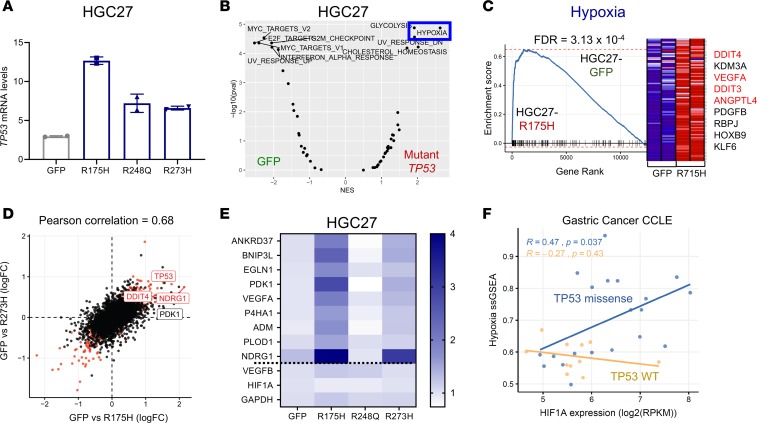
Figure 4. Mutant p53 induces a hypoxia transcriptional program in gastric cancer cells.
(A) mRNA expression of TP53 in the HGC27 cell line expressing the indicated mutant p53. Data are presented as mean ± SD. (B) Volcano plot showing gene set enrichment analyses (GSEA) for pathways enriched in GFP control or combined mutant p53–overexpressing HGC27 cells (using the Hallmark gene set collection). (C) GSEA plot of Hallmark hypoxia gene set enrichment in R175H-expressing HGC27 cells versus GFP controls. Red labels indicate select hypoxia genes. (D) Scatter plot comparing differentially expressed genes in HGC27-R175H and HGC27-R273H compared with HGC27-GFP control (Pearson’s correlation = 0.68). FC, fold change. (E) Heatmap showing 9-gene hypoxia signature across HGC27 cells expressing either GFP control or the indicated mutant p53. (F) Scatter plot showing correlation among Hallmark hypoxia single-sample gene set enrichment (ssGSEA), HIF1α mRNA expression levels, and TP53 mutation status in gastric cancer cell lines. P value was calculated by Pearson’s correlation.

